This thread has been locked.

If you have a related question, please click the "Ask a related question" button in the top right corner. The newly created question will be automatically linked to this question.

CCS v5.2 debugger problem - won't stop at main()

Other Parts Discussed in Thread: MSP430F47197, CC430F6137

Had a working program and while starting a new debugging session the code compiled, downloaded and immediately started running instead of stopping at main. I had not made any changes to properties before this happened.

I loaded another known working TI demo project and it debugs correctly, stopping at main().

I nuked the .metadata folder and removed all other projects, removed an old .launch file and reloaded the working project. It stops at main() and debugs correctly.

I built a new project and added the files from the non-working project and when I open the debugger it just starts running without stopping at main().  

I re-imported the known working project and it debugs correctly.

Why doesn't the problem program stop at main()?

I can't find a .launch anywhere so I'm not sure how the working demo project manages to debug correctly, but it does.

Peter

  • Peter,

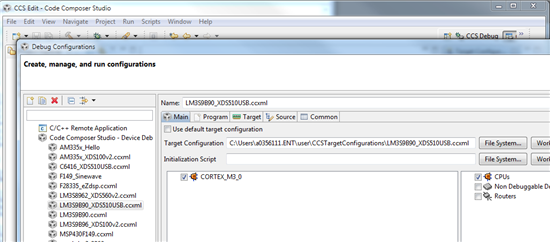
    Did you try to remove the Debug Launch configurations (menu Run --> Debug Configurations)? These are stored in the temporary area of CCS, not in the project itself - therefore any strange effects would span across projects if they use the same target configuration file.

    Regarding the example project, chances are it spawns a different target configuration file (.ccxml), therefore the Debug Launch configuration file will be different.

    Obviously I am taking into consideration that your project is working just fine... :)

    Hope this helps,

    Rafael

  • Hi Rafael,

    Tried that and no joy. I deleted the entire non-working project and the working project and re-imported the working project and added all the files from the non-working project. Naturally, my newest error is a gmake error - no rule to make .lib 

    I'll research that problem and try again.

    Peter

  • Deleted .metadata and re-imported the project and it does the same thing - compiles, links and loads the code into the fr5739. As the debug perspective opens, the main() code file is nowhere to be seen and the target is already running. When I suspend it is in the TI_zero_init assembly code.

    Any other hints?

    Peter

  • Peter,

    Interesting. I know that ELF executables zeroes non-initialized sections by default (the TI_zero_init function). Therefore I ask: was your original project designed for ELF or COFF?

    If COFF, then the import tool may have mistakenly flipped the binary mode - go to the project properties --> CCS General and check the option Output Format

    If ELF, then I would check the discussion below that covers a very similar scenario you are experiencing (apart from the initial link errors, of course):

    http://e2e.ti.com/support/development_tools/compiler/f/343/p/162429/593071.aspx#593071

    Hope this helps,

    Rafael

  • Hello,

    I have the same problem with MSP430F47197.

    I had a working project, after adding some code the debugger don't stop at the main() but is already running. When suspend the debugger is in _TI_zero_init.

    Is there already a solution for this?

    Regards,

    Bart

  • You may have so much data that boot-time initialization takes so long that the watchdog timer resets your system.  See http://e2e.ti.com/support/development_tools/compiler/f/343/p/162429/595497.aspx#595497 for a solution to that problem.

  • Hi Bart,

    I finally found my problem and solved it last night.

    A good portion of the TI examples are done in IAR so I had to convert the _no_init struct definitions to type_def struct(packed.... types and that is where my problem started.

    I have found two ways CCS 5 goes wrong doing this. The first is that when you start a new project the compiler defaults to -eabi which links in the _TI_zero_init routine to zero out the structs. The program never gets out of the initialization phase of the launch so it never gets to main();

    The second thing that can go wrong is if I import a project that was originally done with legacy COFF and your project is using the -eabi the project will choke.

    I solved my problem by setting my compiler output to legacy COFF and now it stops at main() and runs and debugs properly.

    So the take-away is that if I ever see the _TI_zero_init in the dis-assembly then I know I have the wrong compiler output. Pretty quick fix but it took forever to find the solution.

    Peter

  • Hi Archaeologist,

    Thanks this did indead the job. My problem is solved by stopping the WTD in the pr_init function.

    Bart

  • Peter,

    Thanks for the reply.

    Bart

  • I have a similar problem, i am working RM48HDK kit, the debugger does not stop at main and directly start running the code, when i pause it then it is possible to debug it either in run mode or single step. Any tips i am using eabi option and when i try to use the Coff option then it gives me compilation error

    ERROR: VFP floating point support requires --abi=eabi

    Thanks,

    Imran.

  • Hi,

    I have the same problem with Imran using the same kit. Specifically:

    • When writing C code, the program execution stucks at address 0x00000004 for some reason. When I manually write the 'main' address to the PC during emulation, it continues execution normally
    • In assembly only project (using Cortex-R4 CPU Functional Simulator as target), I use Coff and I get the error "ERROR: VFP floating point support requires --abi=eabi"
    I use CCS v4. Any help would be precious.
    Thanks,
    Christos
  • The only other thing I have done to get around the problem is to make sure that the construct for compile time differentiation between Code Composer and IAR is as follows:(.FRAM could be any array of choice)

    #ifdef __CCS__
    #pragma DATA_SECTION(wlan_tx_buffer, ".FRAM_DATA")
    unsigned char wlan_tx_buffer[CC3000_TX_BUFFER_SIZE];

    #elif __IAR_SYSTEMS_ICC__
    #pragma location = "FRAM_DATA"
    __no_init unsigned char wlan_tx_buffer[CC3000_TX_BUFFER_SIZE];
    #endif

  • Hi, I have CCS 5.2.1.00018 , and CC430F6137 and want to implement big ring buffer (size is power of two) , example 2048 Bytes.

    #define BUFFER_SIZE 2048 //
    #define BUFFER_SIZE_MASK (BUFFER_SIZE-1)

    unsigned char buffer[BUFFER_SIZE];
    volatile unsigned read; // int
    volatile unsigned write;
    volatile unsigned count;

    Problem: if size is 1024 or 2048, the program is loaded into MCU and can see buttons like Step in,... After pause, this error appears:


    No source available for "_TI_zero_init(unsigned long, unsigned long) at 0x87ea"

    or in Debug window:
    _TI_zero_init(unsigned long, unsigned long)() 0x0087EA (_TI_zero_init has only skeletal debug info)

    What should to change, because I cant change (I dont understand) linker configuration files,etd. I only want to programming in C main code, not setting a lot of stuff. Thanks, Mykro

    edit: seems that LARGE DATA model works for 2048 :-)  , (but now if I see buffer overflow in 9600UART->38kRF ,there is a something big problem)