This thread has been locked.

If you have a related question, please click the "Ask a related question" button in the top right corner. The newly created question will be automatically linked to this question.

Tool/Graph/Single Time with CCS 5.5 not graphing correctly for an OMAP-L138 (DSP side)

Other Parts Discussed in Thread: OMAP-L138

I have seen issues with CCS 5.4 not graphing correctly and there being a patch.

I have also seen were the issue was fixed in 5.5.  (Using an OMAP-L138 processor, looking at the DSP side)

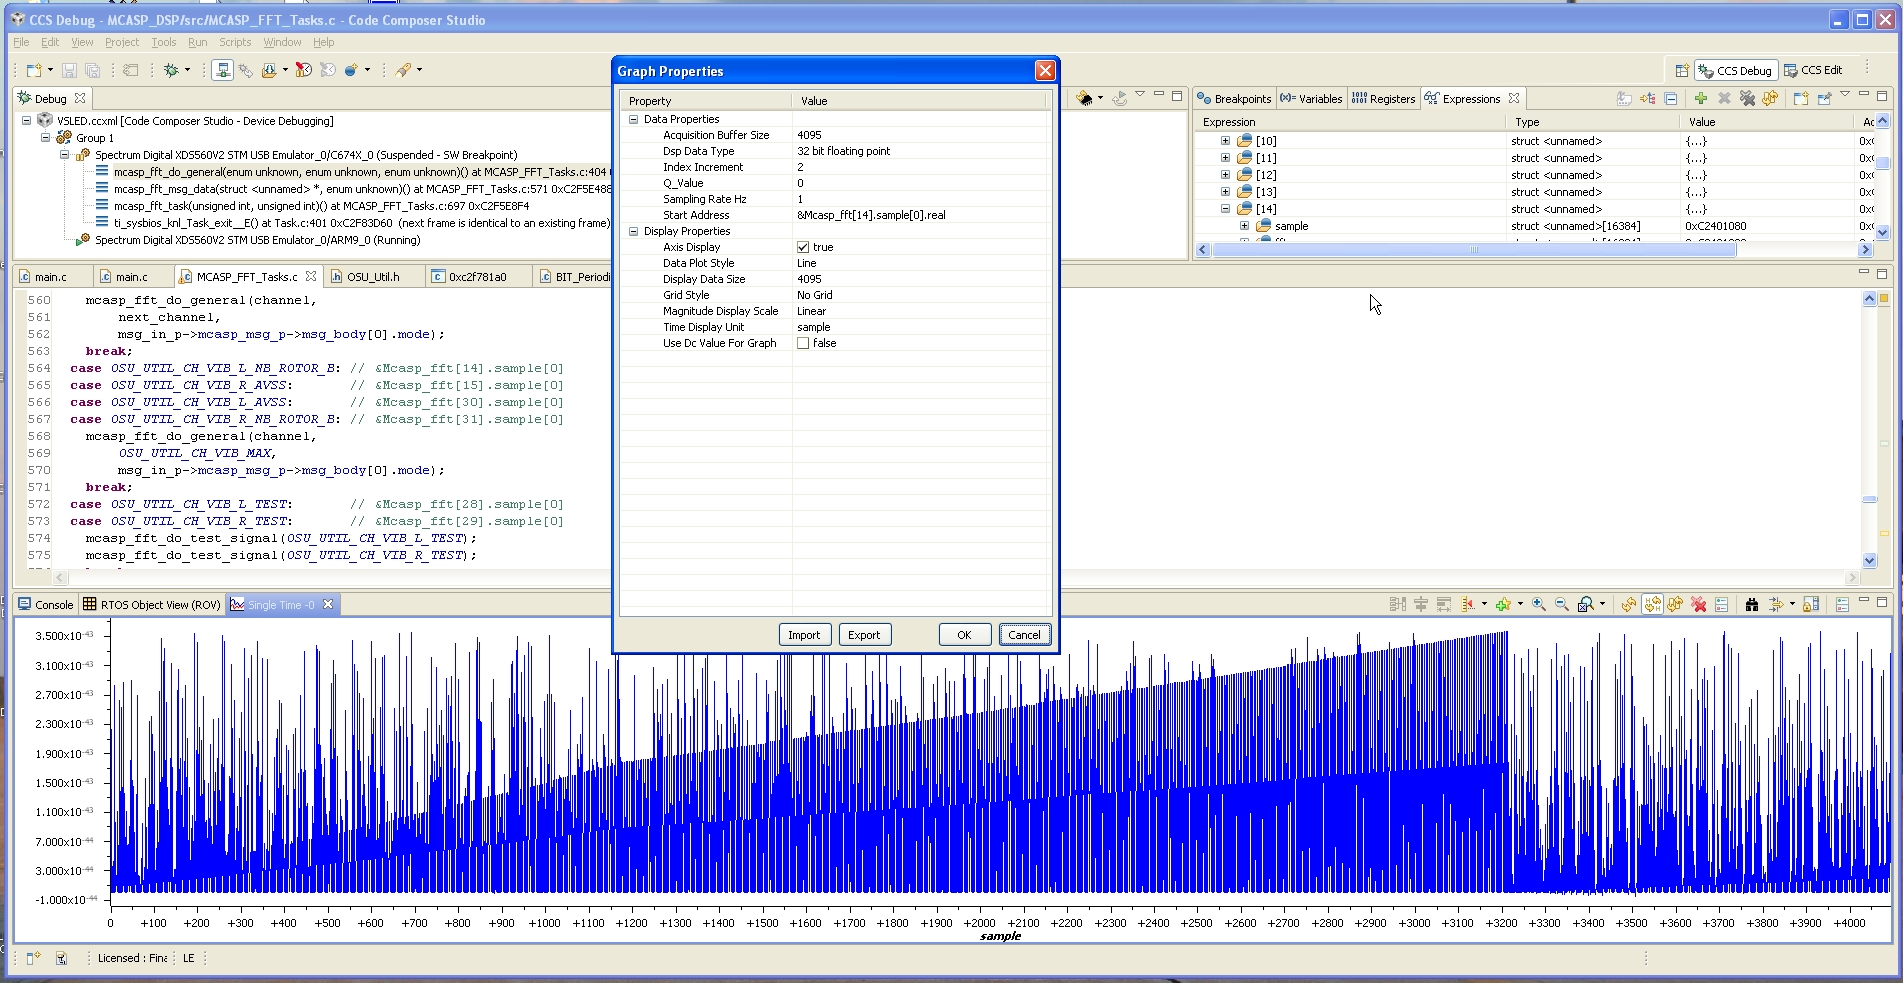
We are trying to graph a 16384 points of signed ints and the graph looks more like (but not quite) and ABS value of what we expect.  We also tried graphing the data when it got converted to a Floating point complex number and still got a graph that did NOT even come close to resembling the data.

I could supply the pictures but dont have access to the system this morning.

We were using 5.3 with lots of success using the Graph Tool.

CCS 5.5.0.00077

  • Hi Mike,

    Mike Geppert said:
    I could supply the pictures but dont have access to the system this morning.

    This would be great. An small reproduce-able test case would be even better.

    Thanks

    ki

  • First picture is of a 16384 X 32bit Float.  Notice the graph has a scaling of 10^(-43) where the data is all 10^(-5).

    Here is the same wave but in signed 32 bit format:

    This is simple as it gets.  The numbrs in memory dont match the graph at all.  No software needed, just dump the memory.

  • Hi,

    A few tips:

    I recall the graph tool had a very strong limit in acquisition and display points in the early versions of CCSv5, but at a certain point this was increased. I was able to display a maximum of 8188 samples in my CCSv5.5.

    In this case, try to decrease both Acquisition data buffer and Display data size and see if the graph displays adequately.

    If not, I would re-check to see if the parameter passed as Start address actually points to the beginning of the dataset of interest. To double-check this, directly paste the memory address of the dataset.

    Hope this helps,

    Rafael

  • I know CCS 5.3 could do 16K samples quite easily.

    I will have access to the system again tomorrow mornign and will see if it works with 8188 (less then 8K?) samples.

  • Here is the capture at 4094 (32 bit floating point real side of a complex number):

    Same data but with 4095:

    I did confirm that if I look at the non-complex data (32 bit signed) I can see 8188 and at 8189 it becomes garbadge...

    If there is going to be a cap on the data, I think it should be what the FFT  can take in which is 64K complex data samples.

    Also if there is going to be a limit I would think that the tool should give out an error message as opposed to graphing garbadge.

    The graph tool is ideal for looking at large amounts of data.  While looking at 4K is better then only being able to look at 100 samples, when you get used to dumping your 16K FFT and then upgrade and now can only do 4K of it, that just hurts.

    Will this be logged as a bug?  How long to get a patch?

    Thanks for you help...

  • Here is what we get for a wave using Excel and just simple dumping the memory:

  • Hi,

    Thanks for sending your findings; they confirm that 8188 is the magic number for a limit of some internal sample counter of the graph display (4094 x 2 = 8188), and therefore this impacts the proper display. I can also confirm that CCSv5.3 nicely displays 16384 32-bit floating-point samples, which is expected (I did not test the limit, but I am sure it is high).

    In this case this is a bug introduced with the newer releases (and not a simple "you hit the limit of the tool"). I will check with the developers and file a bug. I will have to see it is possible to release a patch, but unfortunately I can't make any guarantees.

    I apologize for the inconvenience,

    Rafael

  • Thank you very much for your time!  I really appreciate it.

    If you could keep me up to date I would appreciate it very much.

  • Yesterday I made a fresh, clean install of CCS  Version: 5.5.0.00077

    Today I spent the forenoon finding out why my graphs look like <insert strong language here>. After I found out and know what to search (8188 is the magic keyword) I found this thread and at least the bug is known.

    But it's still there in CCS  Version: 5.5.0.00077 debugging on the C6747 of a TMS320814x.

    Can you estimate when the bug is fixed?

    Thank you,

    Markus

  • Markus, Mike,

    A patch for CCSv5.5 is available at the update site below (you can access it via the menu Window --> Preferences)

    This patch was also made available in CCSv6 ß3 and newer.

    Regards,

    Rafael