This thread has been locked.

If you have a related question, please click the "Ask a related question" button in the top right corner. The newly created question will be automatically linked to this question.

Can't get main() thread showing in debugger

I'm new to Code Composer, so please be patient.

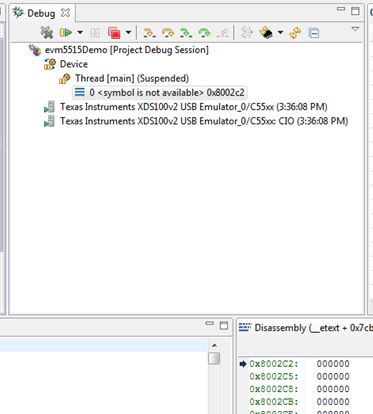
I am inheriting a project that uses a TI C55 DSP with a CCSv4 development environment.  The computer in our lab (which I don't plan to use for primary development or debugging) is able to successfully compile and run the debugger.  A partial screenshot is here:

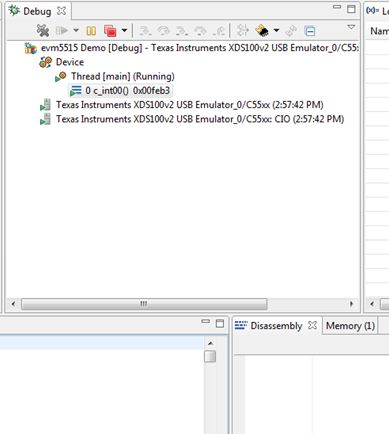
However, when I loaded CCS in my laptop and imported the project, the debugger cannot find the main program, and therefore does not run, as shown below.  I am expecting the debugger to find the main() thread in startup.c, which is partially shown, but it does not.  There's probably something fundamental that I am missing or needs to be changed in my compile/debug options, but can't seem to find it.

I am getting a <symbol is not available> message.

Thanks in advance for any help you may have.

Kevin


  • Kevin,

    Sorry for taking long to reply. Are you still having this issue?

    One of the most common details that prevent the code from reaching main() is hardware initialization - either from a GEL file or from the code itself. Given the code is the same, I suspect the presence/absence of a GEL file may be getting in the way of a successful run.

    Several threads like this one discuss this and similar scenarios. You can search for "code does not reach main -msp430" and see if other ideas may come (the last -MSP430 is due to an issue with the compiler tools that is not applicable to C55x)

    Hope this helps,

    Rafael

  • Hi Rafael,

    Thanks for the response.  I thought that the issue was solved as I was running the wrong debug session.  After pointing to the correct debug session, the debugger ran normally.

    However, after a week of inactivity, I ran into a similar problem in which the debugger sometimes runs and sometimes does not make it to main().  It comes up with one of the screens shown below.  When it doesn't run, the .gel file is not getting run as the "PLL 100 MHz" and other print statements do not get displayed.

    Some observations:

    1. Debugging is MUCH more successful if the program flash has not been programmed. I received some unprogrammed boards (we use the debugger to program them) and was able to run the debugger reliably, but after programming the boards and recycling power (so they power up running off flash), the debugger usually does not work.

    2. I modified the compatibility mode for the eclipse.exe program to run in Windows XP (Service Package 3) compatibility mode.  This improves debugging success.

    3. Resetting my computer improves the chances of running the debugger.

    4. My coworker does not have any issues.  We are both running Windows 7 but his is a desktop that is 4 or so years old while mine is a laptop that is about 1 or 2 years old.

    If feels like it is a PC compatibility issue between my laptop and CCSv4, but don't know what to do.

    Some screenshots of what comes up when the debugger runs and the debugger does not run.

    Good:

    Bad1:

    Bad2:

    Thanks,

    Kevin