This thread has been locked.

If you have a related question, please click the "Ask a related question" button in the top right corner. The newly created question will be automatically linked to this question.

Plot Trigonometric function in Single time graph

Other Parts Discussed in Thread: TMS320F2808

Board: TMS320F2808

Hello Every one,
I am writing a sin() function code for plotting a sin wave in Graph window
Can you tall me, what i set in the option of Graph Properties (or any other setting), so that sin() function graph will be visible in the graph window.
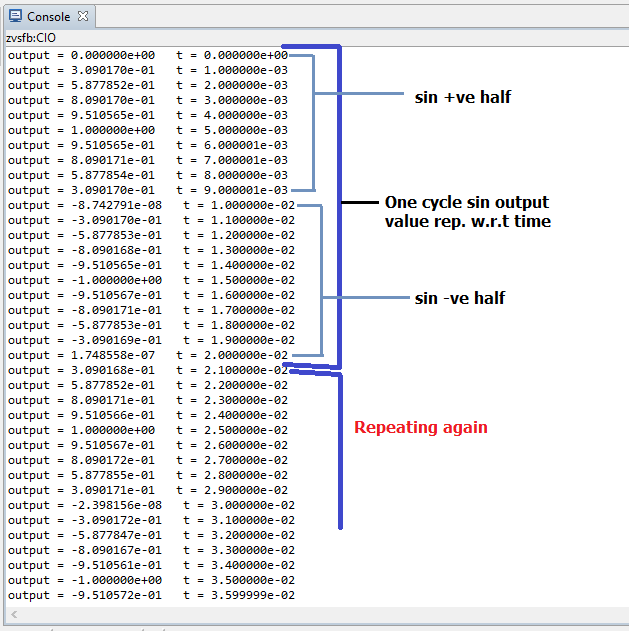
I am writing error less code and "printf" print all the value of equation "output" perfectly.

#include<stdio.h>
#include<math.h>
#define PI 3.1415926

float t,output;
void main()
{
int f=50;
for (t=0; t<600; t+=0.001 )
{

output = 300*(1+sin(2* PI* f* t));
printf( "output = %e t = %e\n", output, t );

}
}

Hint:- Above equation "output" generate a sinusoidal waveform.

  • Hi Asim,

    This depends on the update rate. The graph update rate is around 500ms and can be tweaked to 100ms (risky). Only if your variable update rate matches your graph update rate, you'll be able to see a sine wave.

    Regards,
    Gautam
  • I am not cleared.

    In the above code when we run the output value printed w.r.t time(t) and those value represent like a sin wave value, but the Single time Graph not read that values.

    Inserting screen-shoot of that value, which in tabular form w.r.t time.

  • Asim,

    I see you are already working with Aarti on the other thread below. To avoid duplicate effort, please refer to that other thread to move forward with this discussion.
    e2e.ti.com/.../446284

    Thank you,
    Rafael
  • Ok desouza,
    still i'm not clear about the plot in Single time graph window for sin wave.