This thread has been locked.

If you have a related question, please click the "Ask a related question" button in the top right corner. The newly created question will be automatically linked to this question.

CCS6.1.0: EnergyTrace Reference profiles are plotted incorrectly

Other Parts Discussed in Thread: ENERGYTRACE, MSP-EXP430FR5969, MSP430FR5969, CCSTUDIO, MSP-FET, CC2650

Hi,

I've just noticed a problem with the way that reference profiles are plotted on the EnergyTrace Power and Energy graphs. There seems to be a horizontal scaling effect that is tied to the power consumption measured in the current energy profile.

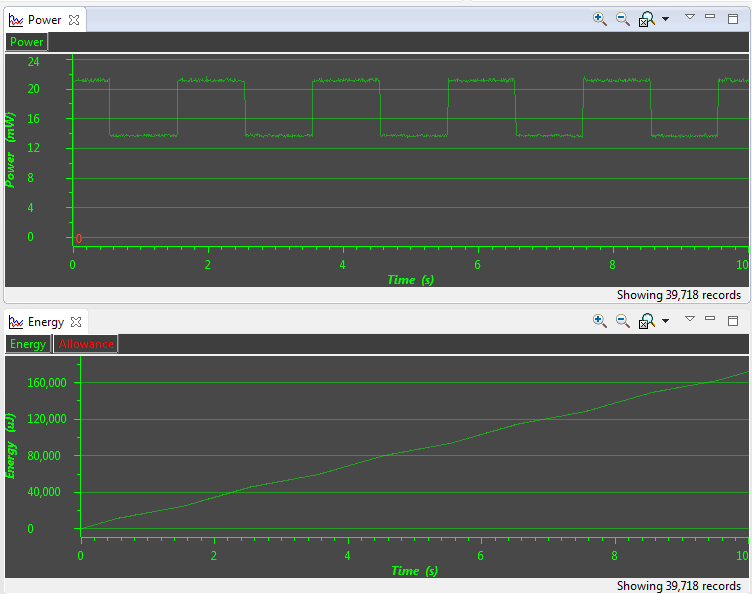
I have a reference profile which was recorded over a 10 second period while the target board flashed an LED at approx 0.5Hz. The Power graph clearly shows a square wave of ~0.5Hz due to the power consumption of the LED.

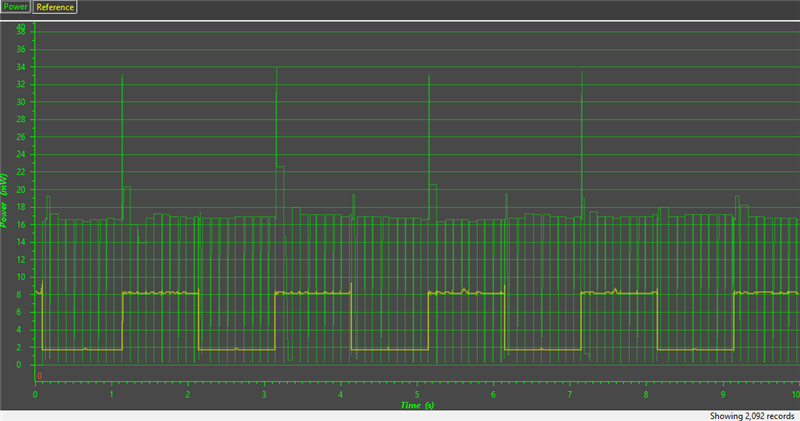
If I load this reference file and take a new capture of 10 seconds duration with relatively high power consumption the result looks like this:

The reference Power trace looks reasonably accurate. On the Energy graph the final value for the energy used during the capture is close to that shown on the main EnergyTrace window.

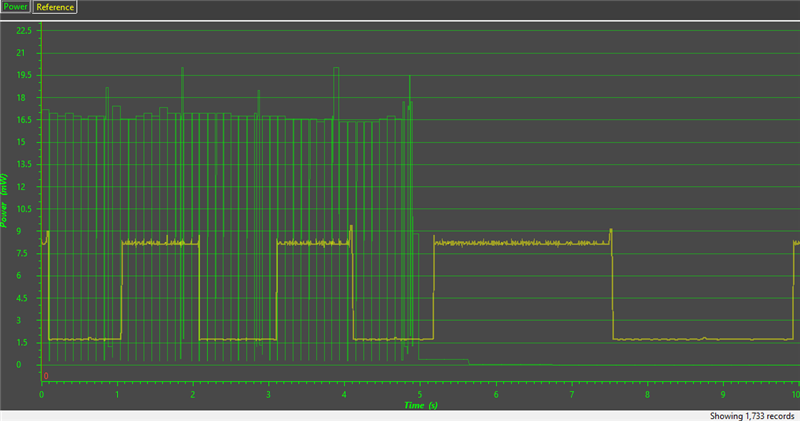
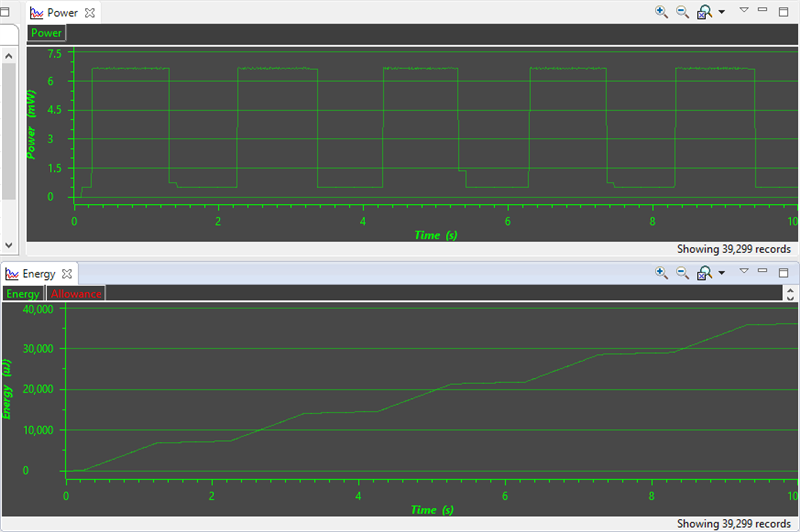
Using the same reference profile, I then took another capture where the power consumption dropped significantly at the 5 second mark:

When the power consumption in the current trace falls the reference timebase is stretched and the squarewave changes from ~0.5Hz to ~0.2Hz. Also, the final point of the reference trace on the energy graph is at about 38mJ, but the main EnergyTrace window says that the total energy used over the trace is over 49uJ.

Is this a known issue?

  • Hi Robert,

    This is not a known issue.

    It will be great if you can share the 2 out files used and see whether I can reproduce the issue.

    Thanks,

    Bruce

  • Hi Bruce,

    I've attached a single .out file that covers both cases. It's written for the MSP-EXP430FR5969 launchpad, and demonstrates another bug I noticed with EnergyTrace rendering. To see the original bug with reference graph rendering you'll also need an MSP-EXP432P401R launchpad.

    The firmware just toggles the green LED on the launchpad at 0.5Hz with the MCU in LPM3. Pressing the P1.1 button will toggle the red LED on/off. This is used to switch between low and high overall power consumption.

    The first issue is a mismatch between the energy and power graphs shown on a capture when measuring very low power levels.

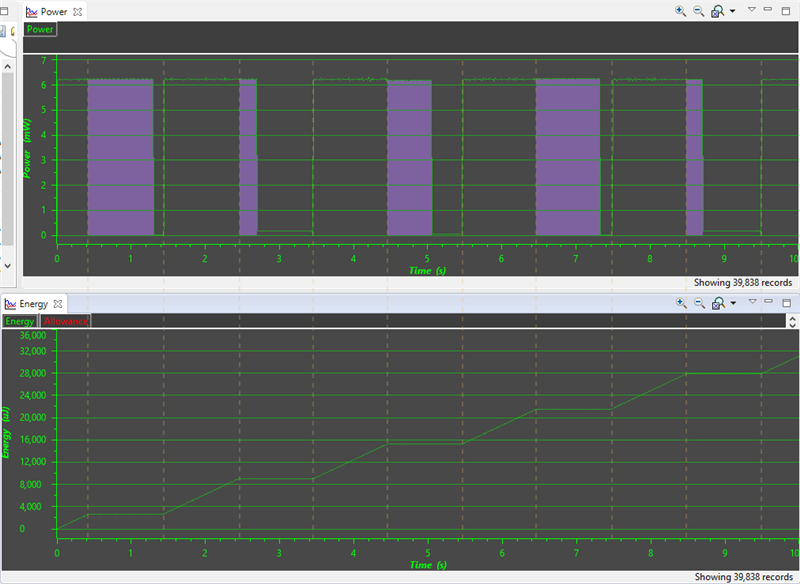
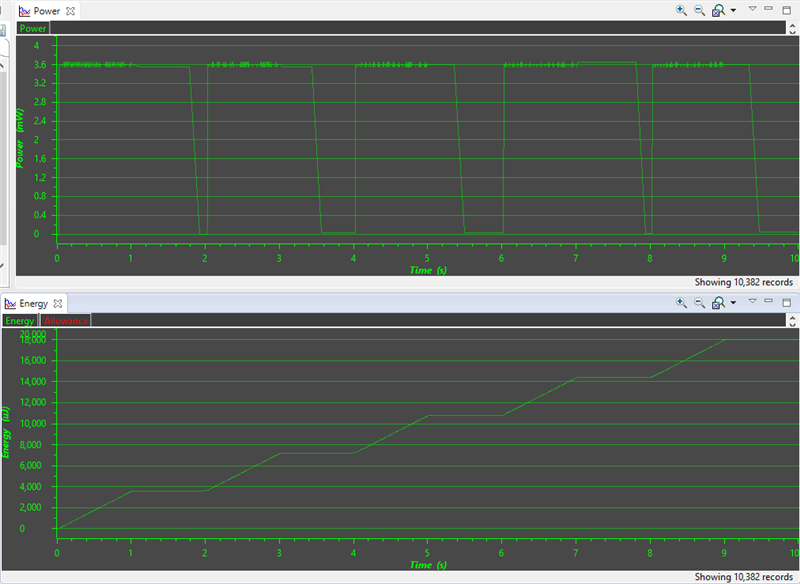
    With the .out file flashed to the MSP430FR5969 on the launchpad, terminate any JTAG connection and start a standalone EnergyTrace session. This avoids the extra power drawn by the emulator which skews the results and makes the issues less obvious. I also removed the TST and RST jumpers from the board, so only V+ and GND were connected to the eZ-FET. Making sure the red LED is off (which should be the default state) take an EnergyTrace capture of at least 10 seconds. I got the following result:

    I've highlighted the power graph to show where it doesn't match up with the energy graph. The energy graph appears to be correct, so I think the measurements taken by the EnergyTrace hardware are correct. The problem occurs in the derivation of the power graph from the energy data. This error is carried through to the mean power (and hence current) shown on the main EnergyTrace window.

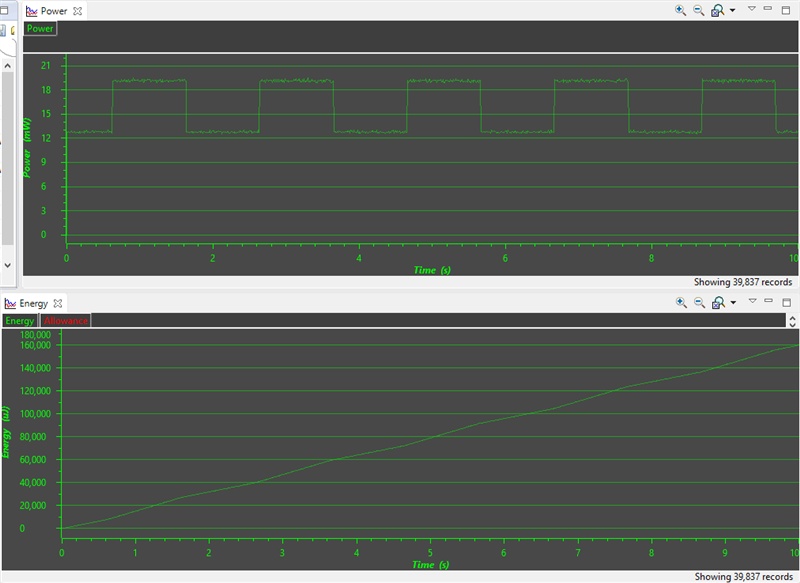
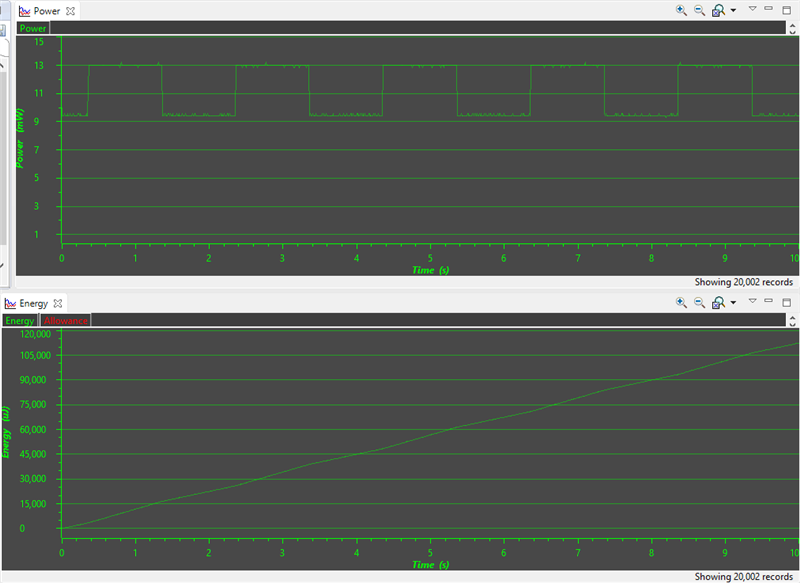
    Pressing the P1.1 button to light the red LED and repeating the test gives this result:

    With increased power consumption, the power and energy graphs match up. The mean power/current values are also correct in this case.

    The same steps can be repeated using the XDS110-ET on the MSP-EXP432P401R launchpad to provide external power to the MSP430FR5969 target running the test code.

    With the red LED off:

    and on:

    Basically the same issue occurs, but notice the record counts in the bottom right corner of the graphs. With the XDS110-ET there seems to be a reduction in sample count for lower power levels. That didn't occur with eZ-FET on the FR5969 launchpad.

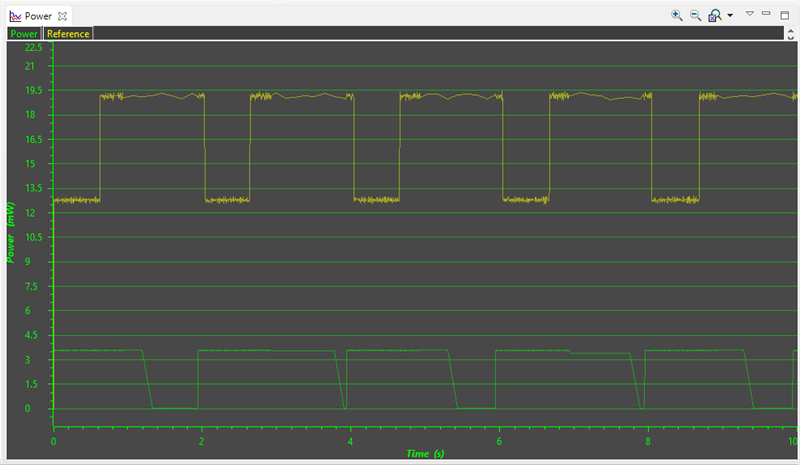
    Loading the high power eZ-FET profile as reference with the XDS110-ET capture at low power looks like this:

    The reference gets stretched where the power level on the main trace should be low (ignoring the fact that the first bug makes it appear high when it isn't). That happened to align with where the reference trace was high in this case, but that's just a coincidence.

    In this case the reference trace on the energy graph is also incorrect - it's aligned with the incorrect power reference trace. The "stretching" means that the value shown at the right hand side is not the correct final energy value as shown in the main EnergyTrace window.

    This issue doesn't occur when loading a reference alongside either of the eZ-FET captures, nor with the high power XDS110-ET capture.

    Here's the .out file (renamed as .dat to get past the forum filter)

    EnergyTrace_Test.dat

  • Hi Robert,

    Thanks for sharing the test program. Unfortunately, I could not reproduce the issue with my set up here. My hardware/software version may not be the same as yours. I have attached the results I got at the end.

    This could be an issue in a particular revision. Looks like something strange happening when capturing voltage/current (not energy) in lower power case. Would you provide more info on the revision of your Launchpad, emulator and CCStudio.

    A few important notes for comparing power & energy usage:

    • In order to have a reasonable comparison, the codes range ran is very important.
    • Both runs should start at the same location.
    • The best practice is to set a break point, like before turning on the LED, and let the CPU halt there.
    • Launch EnergyTrace if not launched already.
    • Switch to EnergyTrace only mode, not EnergyTrace++, if needed.
    • Do a "Free Run" under CCS toolbar -> Run
      • This "Free Run" will run the target and disconnect the emulator from the target. So no power is drawn from the emulator.

    The above procedure will ensure the measurements are aligned at code level, i.e. the time align with the program counter.

    [ --- my results -- ]

    Lower power:

    High power:

    Bruce

  • Missing pictures ...

    Lower power:

    High power:

    Bruce

  • Hi Bruce,

    I'm using Code Composer Studio Version: 6.1.0.00104. My MSP-EXP430FR5969 is a Rev. 2.0 board, with a Rev. 1.2 eZ-FET. During my measurements I only have the GND and V+ jumpers in place. J10 is set to power from debugger, the supercap is bypassed at J2 and the supercap charge jumper J11 is open. The current jumper J9 is closed. I usually start a standalone EnergyTrace session without the debugger active, but I get the same results when Free Running from the debugger as you've described.

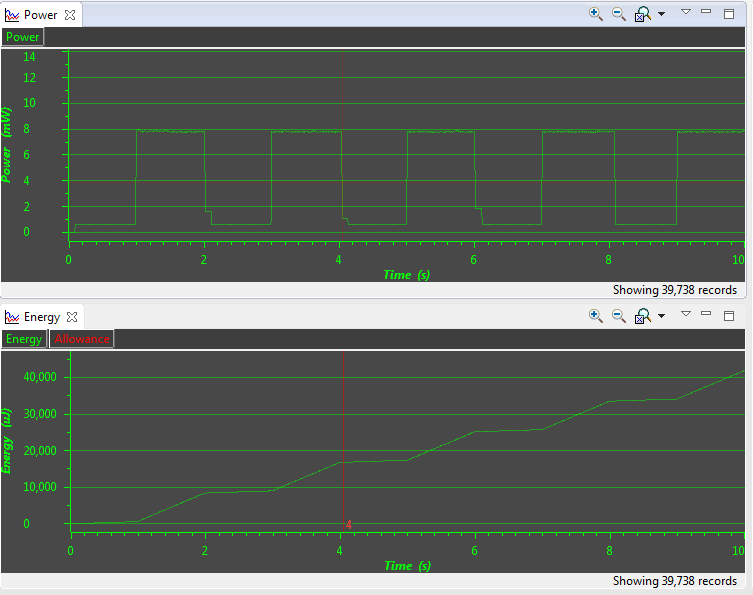
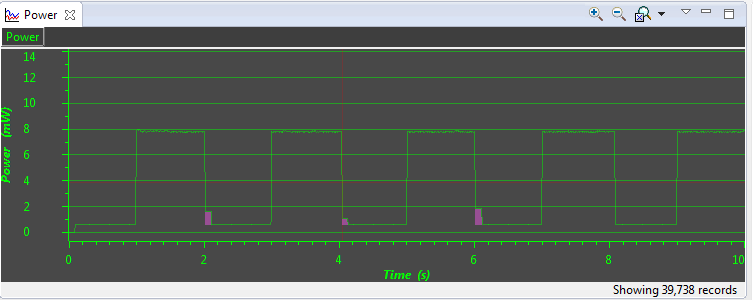
    Your screenshots actually do show the issue, but it's a lot less obvious than in my test case. These little blocks highlighted in purple at about 1-2mW don't belong there:

    The error is far less severe in your capture because the overall power consumption is higher than in my captures. My low power capture on the FR5969 launchpad peaks at 6.2mW, falling to a minimum of ~0.01mW during LPM3. Your first capture peaks at almost 8mW and only drops to around 0.7mW in LPM3.

    That minimum power level of 0.7mW is almost 200uA, which is too high to be the current drawn by the FR5969 in LPM3. Do you have the UART jumpers in place on the board? In particular I find that having the RTS jumper in place increases the power consumption by 0.5mW, because this firmware sets all unused GPIOs to input with pulldown.

    For comparison, here's what I get when the RTS jumper is in place:

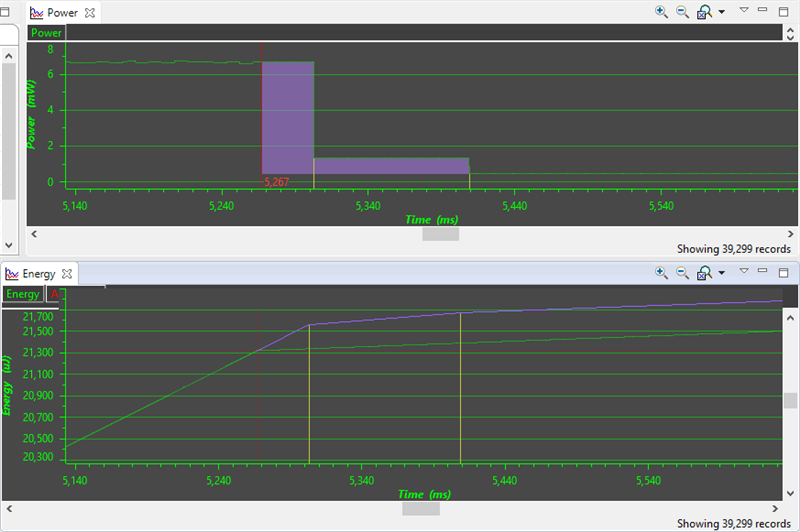
    Now a closer look at the 1.3mW step after the power level drops at 5.3s:

    EDIT: I've updated this picture to show my estimate of what the energy graph would need to look like to match the power graph shown. The original trace is green. On the power graph the purple area shows the section of the graph that doesn't match the original energy graph trace.

    The zoomed-in energy graph has two linear segments which meet at 5267ms. This is the only point that the gradient changes on the zoomed energy graph. The power graph should show a corresponding step-change at 5267ms, but instead it changes twice, at 5302 and 5409ms.

  • Hi Robert,

    I can reproduce the issue with a similar setup as yours now. Thanks for your inputs.
    Yes, there are issues in Power measurements and presentation while the target is at ultra-low power level. The issues are for Power only, it does not affect measurements and profile result for Energy which is more important.
    So referencing to your last screenshot, the energy graph is correct but not the power. The power graph should show a drop at ~5.267s.

    I'll file this for future releases.

    Bruce
  • Thanks for looking into this, Bruce. Did you also reproduce the reference profile issue that only occurs on the MSP-EXP432P401R? That one seems quite similar, but affects both the energy and power graphs on the reference profile.
  • Hi Robert,

    Yes. They are all caused by the same root.

    The live energy measurements, profile and graph are still correct. Just the overlaying of reference graph may be off when in ultra low power region.

    Bruce

  • Hi All,

    I Think I've got the same issue (bad power rendering in energy trace) on MSP40F5438A with CCS 6.1.3,

    See following post

    When do you think there will be a palliative for it ?

  • The thread link seems to have gone wrong, it should point to here: https://e2e.ti.com/support/microcontrollers/msp430/f/166/t/512955.

  • A fix for MSP-FET is targeted for CCS_7.0, 4Q 2016.

  • I'm surprised that the fix affects the emulator firmware; I thought the derivation of power from energy would happen on the host PC. Is the fix going to be implemented for the launchpads with energytrace too?

    In the meantime it would be great if there were a workaround for the issue. There's a post on the MSP forum by someone who's using libmsp430 to read the data without using CCS, and they found that deriving power/current measurements from the energy values gave better results. I'm not sure if I can do that because I'm working on a CC2650 target using an MSP432 launchpad's XDS110-ET at the moment.

    does mention in that thread that CCS is going to support CSV export of EnergyTrace profiles at some point. Is that likely to happen before CCS7.0?

    Also, it looks like DSS already supports energytrace data export, but there doesn't seem to be any documentation. If I could get some information on how to start an energytrace profile using DSS without needing a debug connection that might be a viable option.

  • CCS_6.2 will have CSV export available to end user.

  • Bruce Lee (SDO) said:

    CCS_6.2 will have CSV export available to end user.

    That's great news, thanks Bruce!