art Number: CODECOMPOSER
Tool/software: Code Composer Studio
Hi, I have the TI's TM4C123GXL Tiva Launchpad.
I'm referring the Tiva Launchpad Workshop document - Procedure 10 of Lab 9.
In lab 9, it calls the "sinf" function and plots it using CCS.
I use Matlab 2016 and CCS 7.1.0.00016 on 64-bit Windows 10 machine.
// float gSeriesData[SERIES_LENGTH];
float gSeriesData[  ] = {
#include "matlab/mySignal.txt"
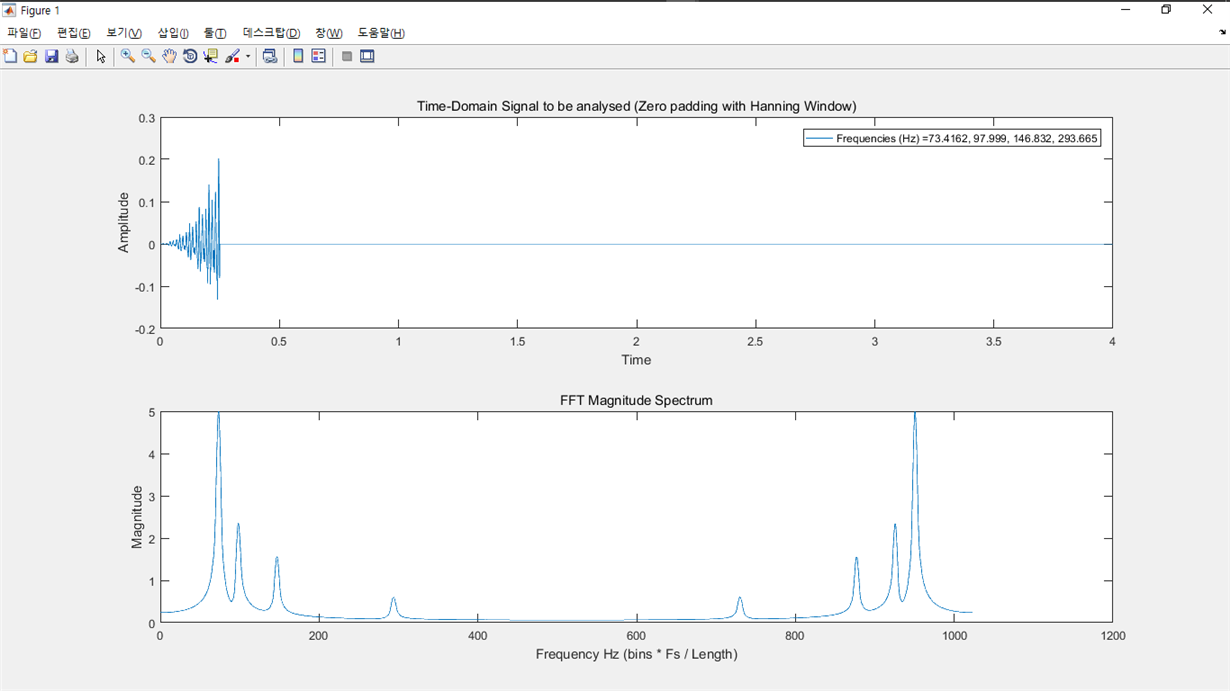
// Used Matlab to generate sum of cosine waves which have
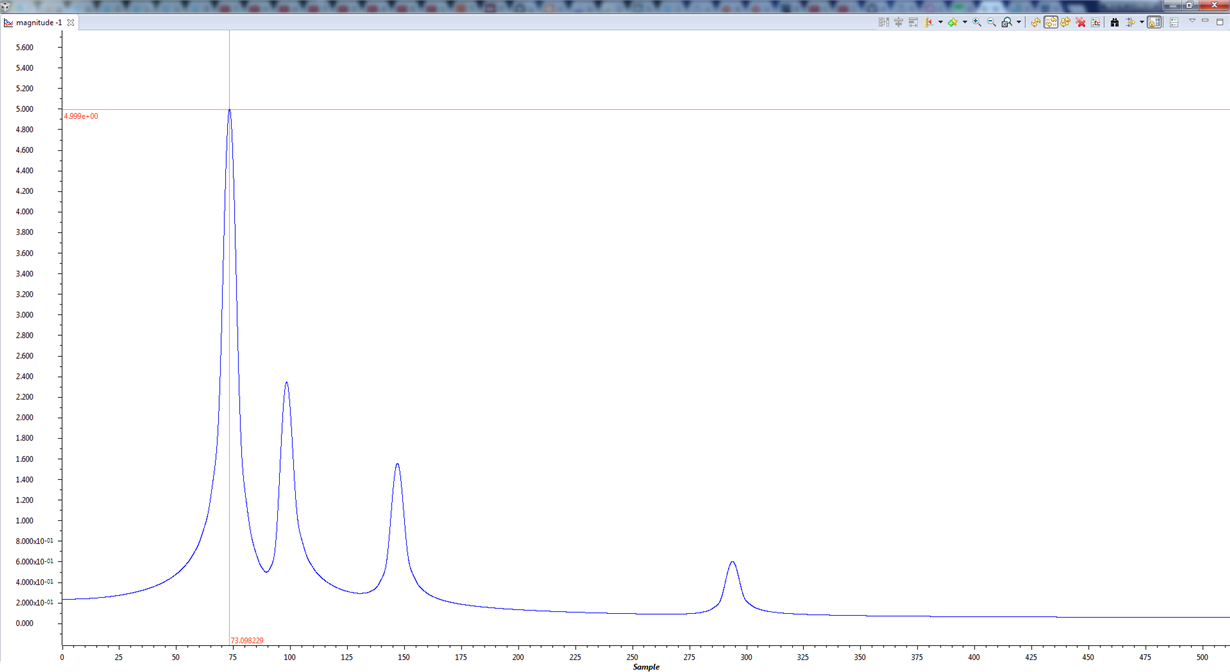
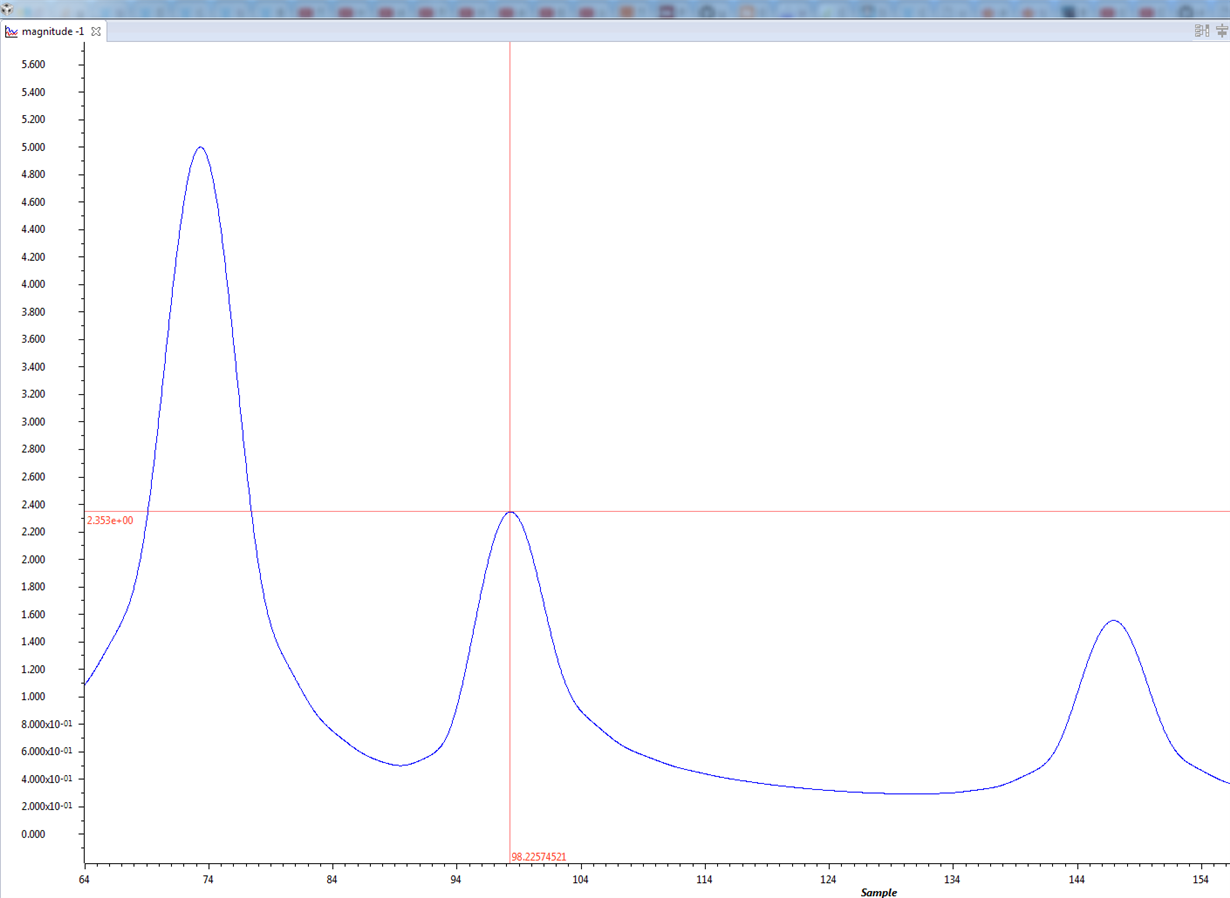
// 73.51Hz(Note D2), 97.99Hz(G2), 146.8 Hz (D3), and 293.67 Hz (D4) (only real values, no imaginary values)
// + Zero padded + Hanning Window
// Signal length = 4096, Sampling Frequency = 1024 Hz
};
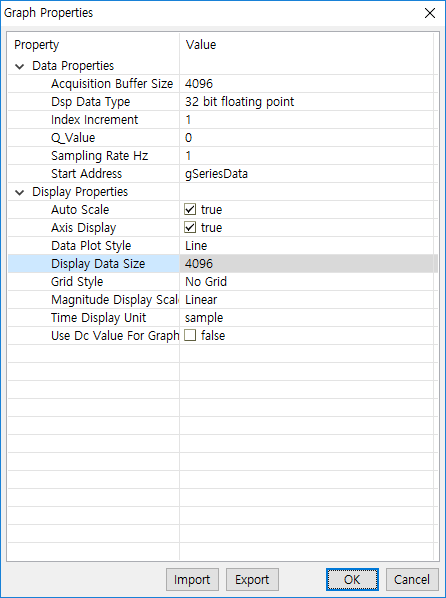
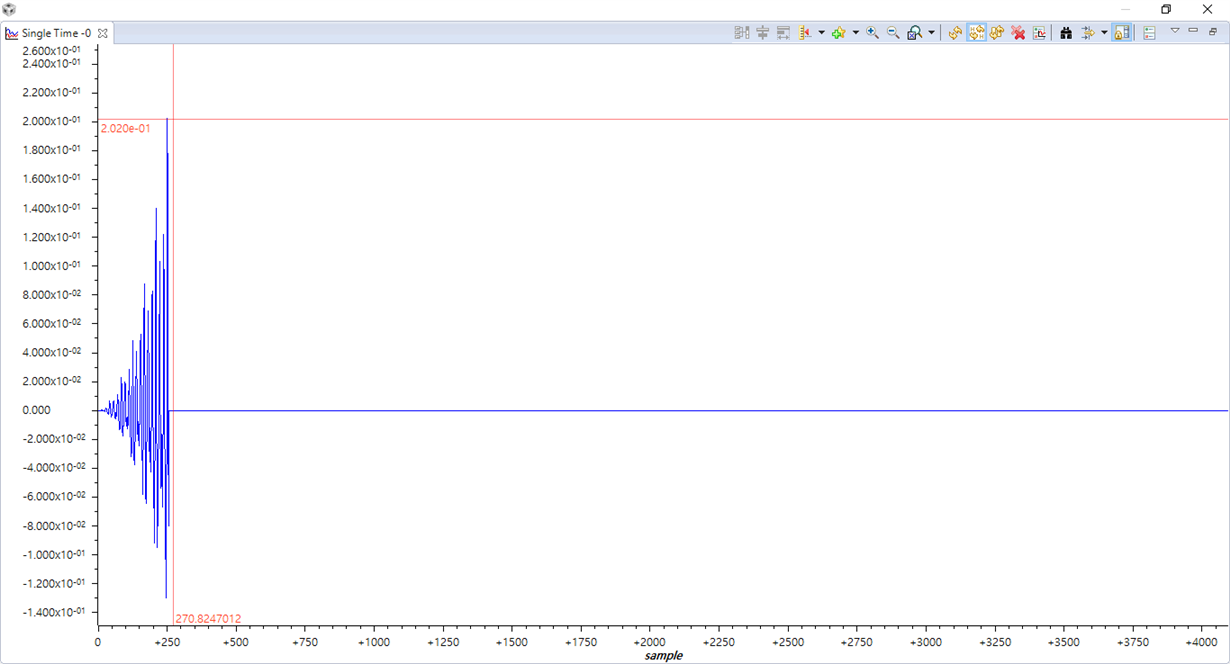
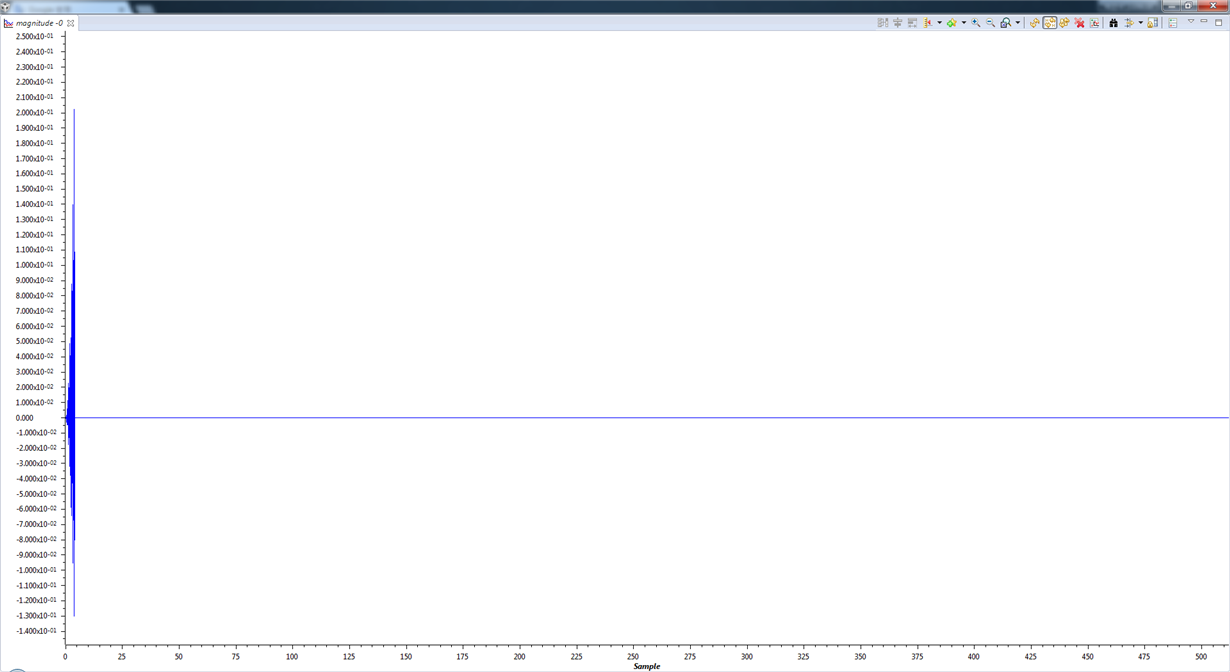
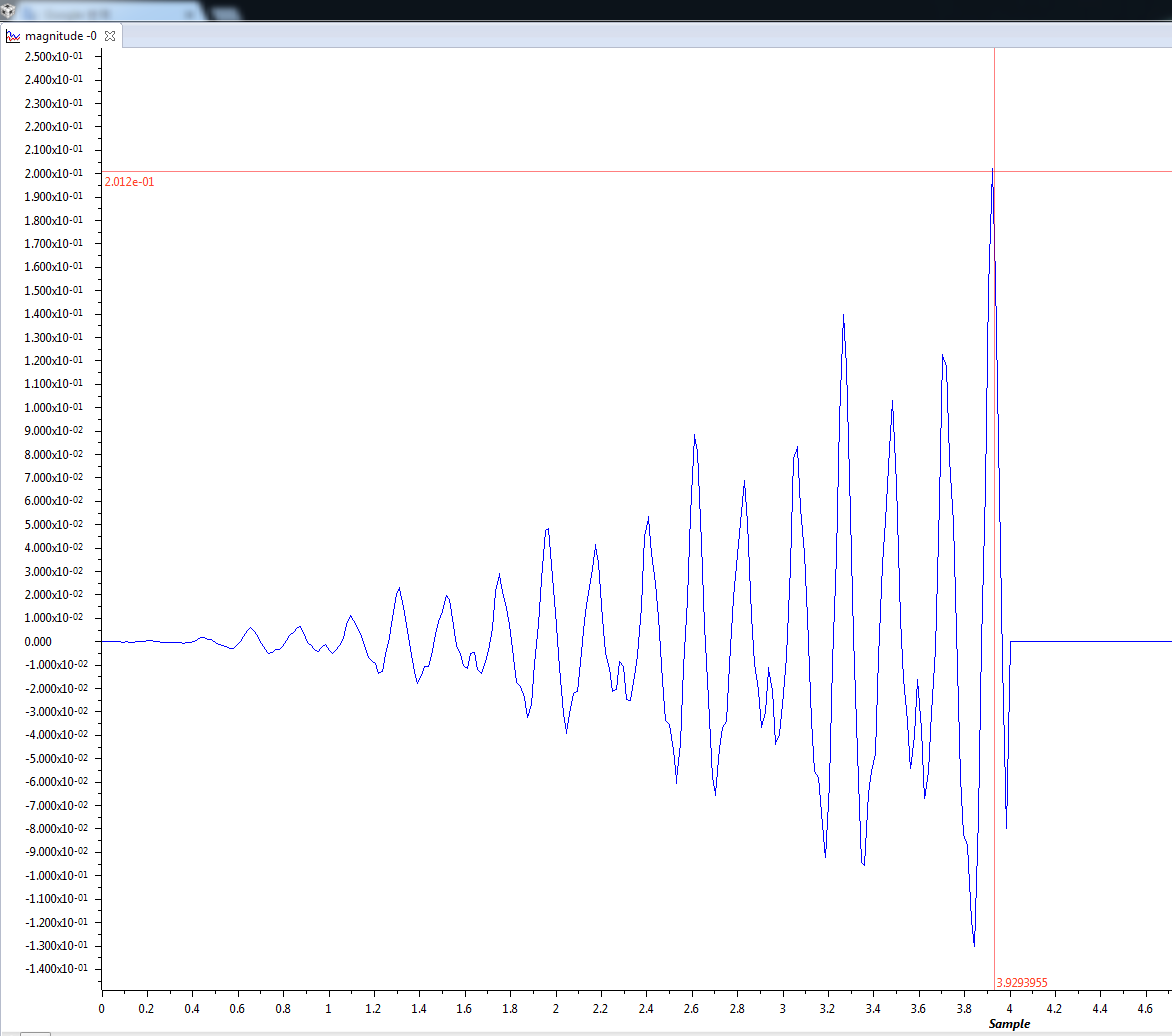
I replaced that part and plotted the single time graph.
This part is great. I don't have to execute Matlab all the time to check the values of the array.
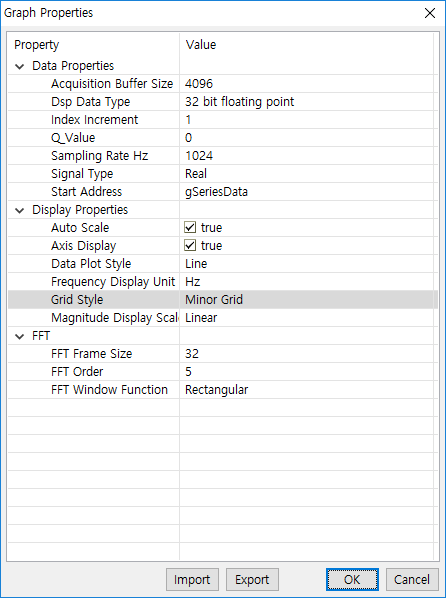
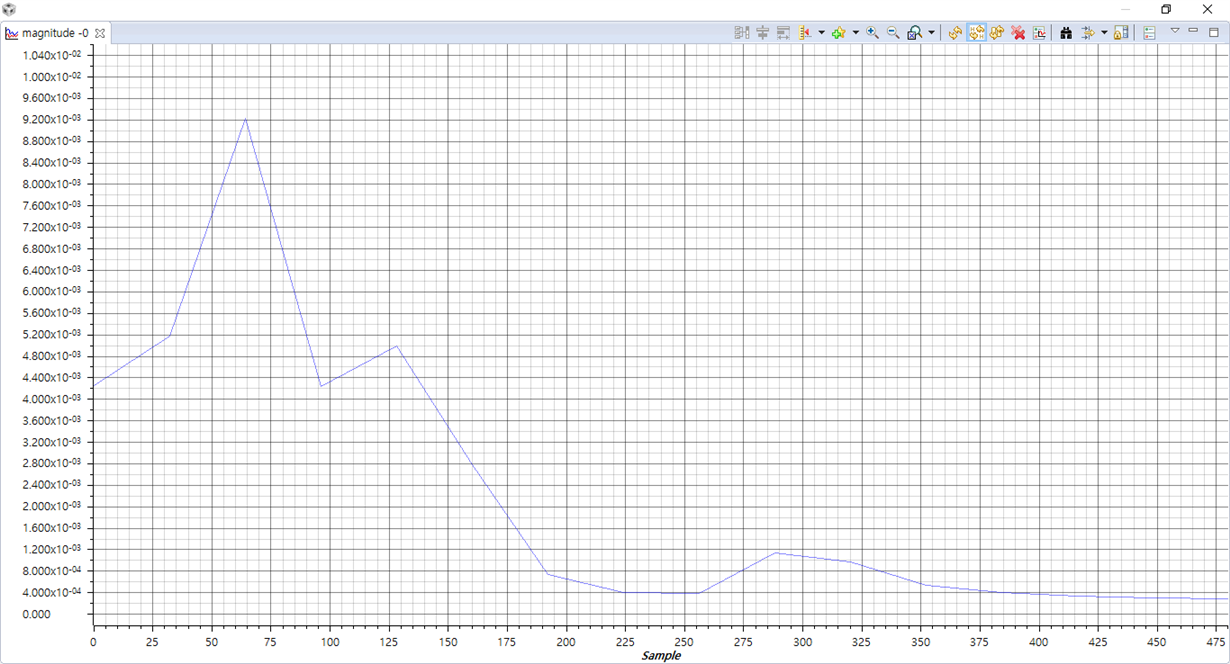
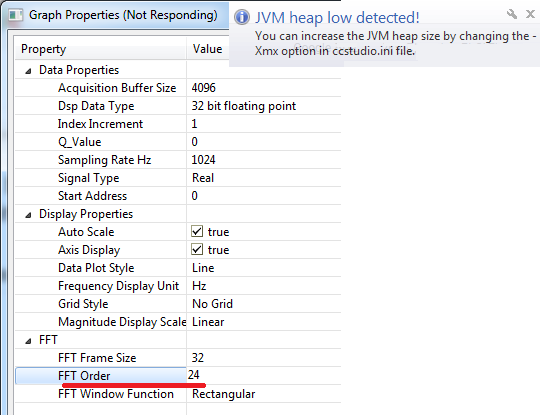
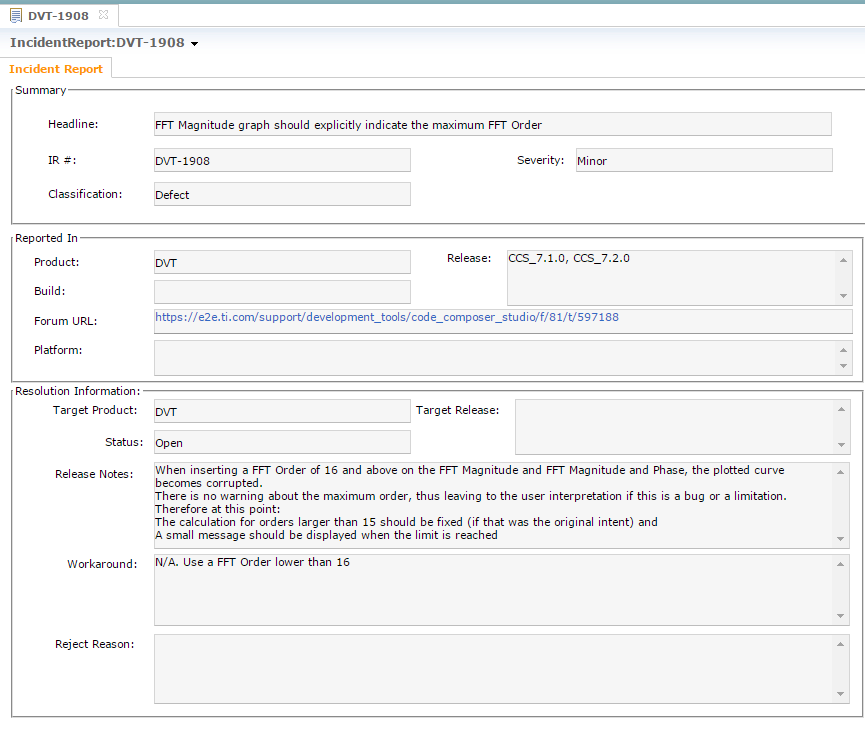
However, I had trouble configuring the FFT Magnitude graph.
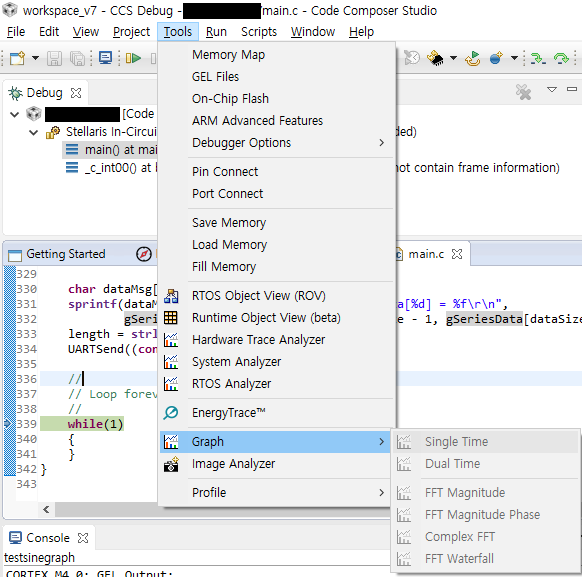
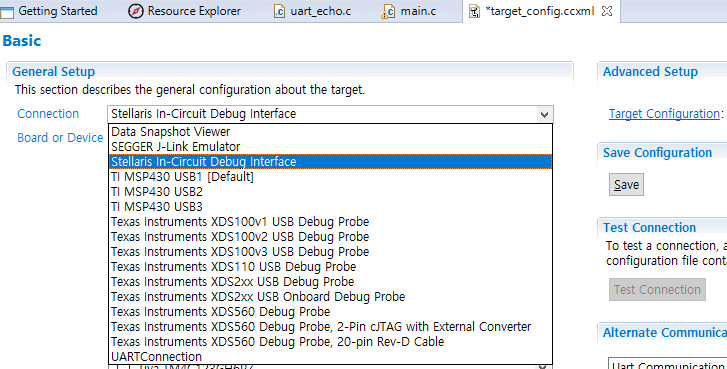
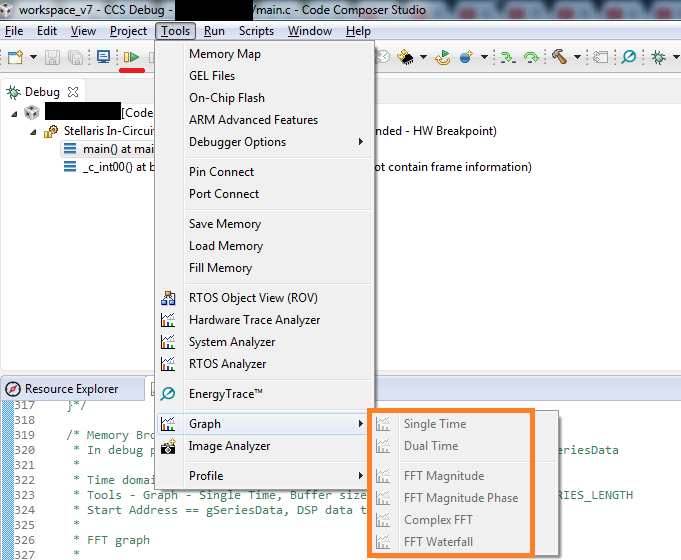
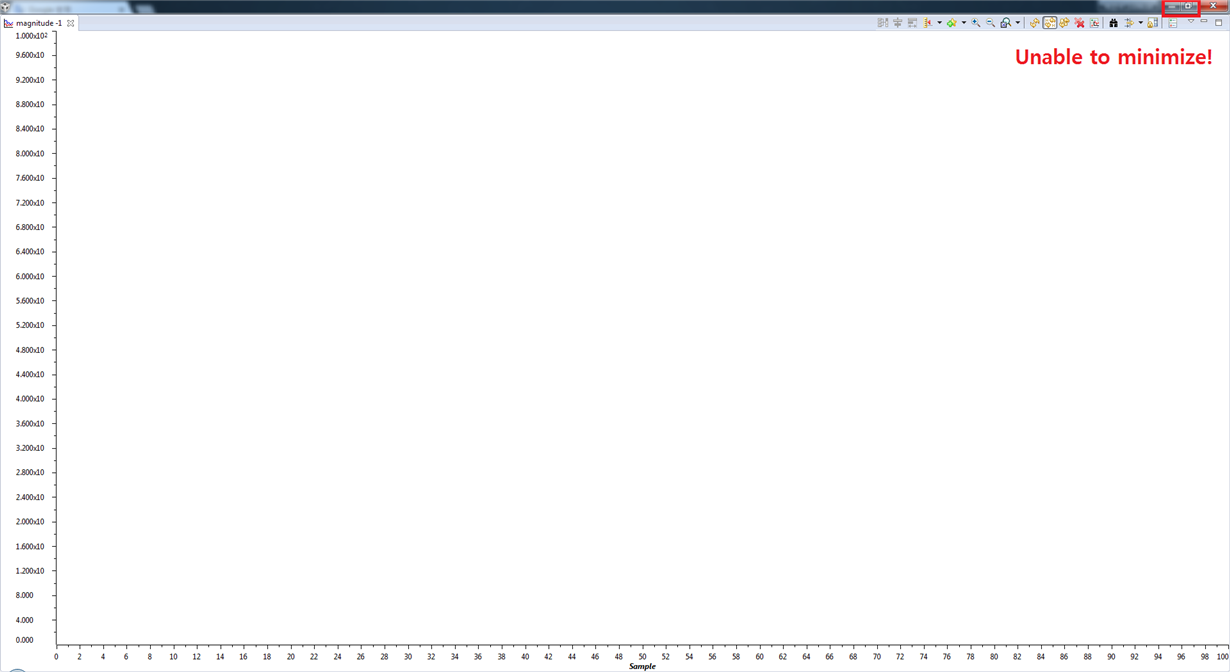
Even worse, sometimes, I cannot select those graphs; they were grayed out while I'm debugging with CCS 7 and the Tiva Launchpad.
In short, I want to ask the following;
1) I expected the FFT feature to analyze the frequency of the signal array.
Can you help me with configuring the FFT Magnitude graph?
How should I configure it to get the same result which is shown from Matlab?
2) Why is the Graph section becomes grayed out?
How can I fix this?


