This thread has been locked.
If you have a related question, please click the "Ask a related question" button in the top right corner. The newly created question will be automatically linked to this question.
Part Number: CCSTUDIO-TM4X
Tool/software: Code Composer Studio
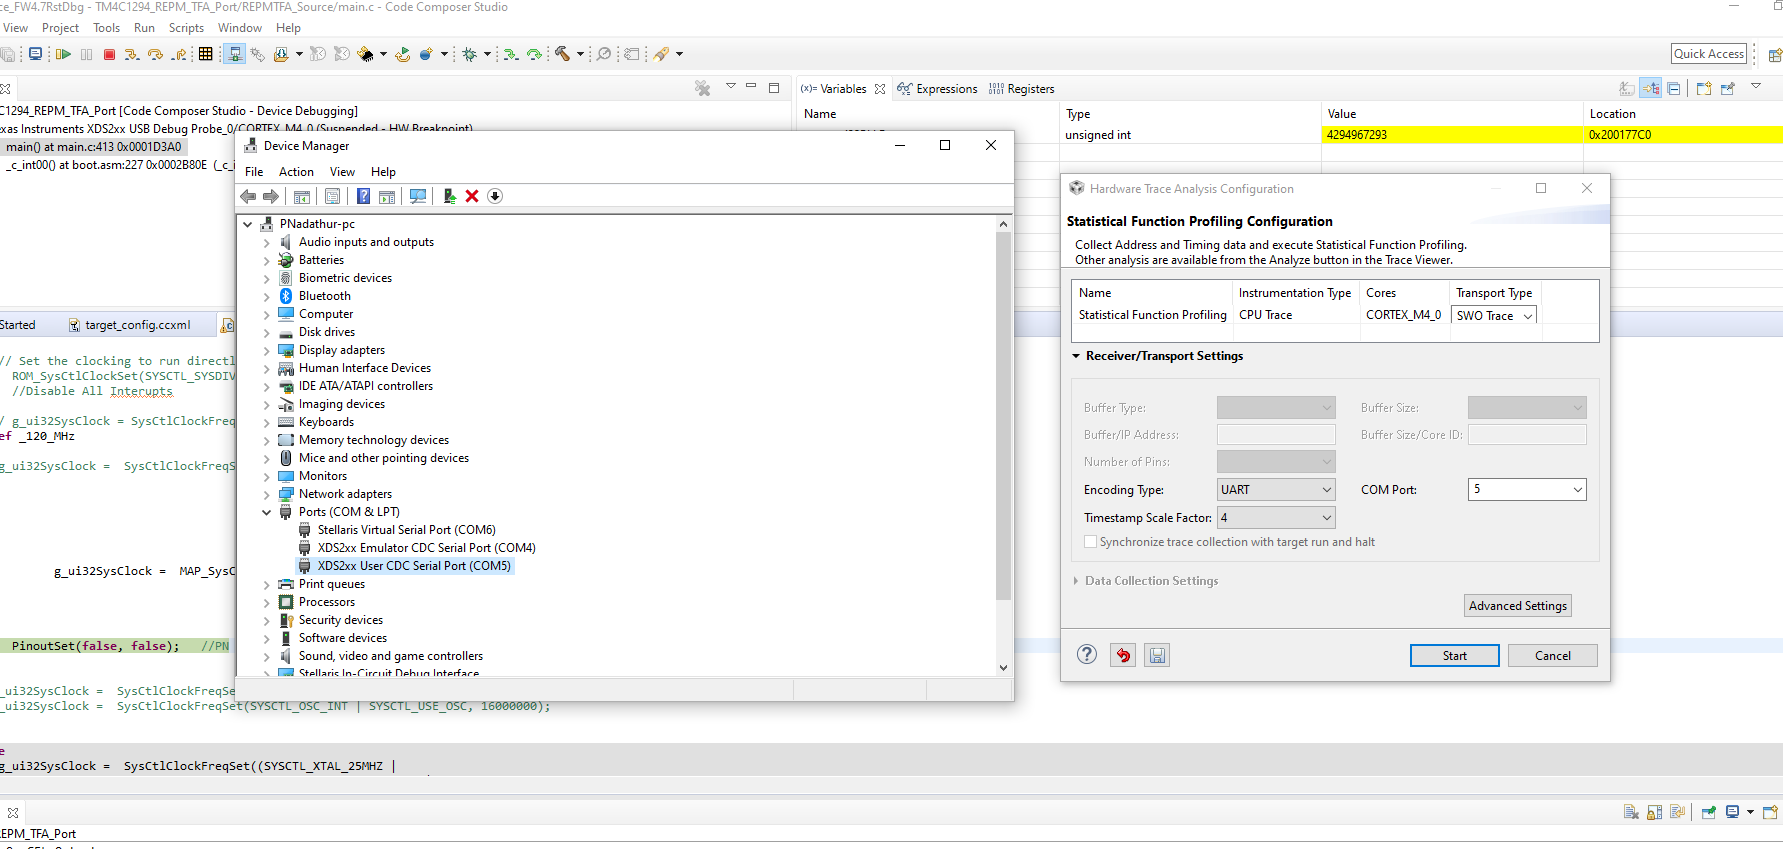
After a clean install of ccsv9, I was able to start the hardware trace analyzer successfully on one workspace
yesterday and I collected one trace. The analyzer would not start on a different project workspace yesterday.
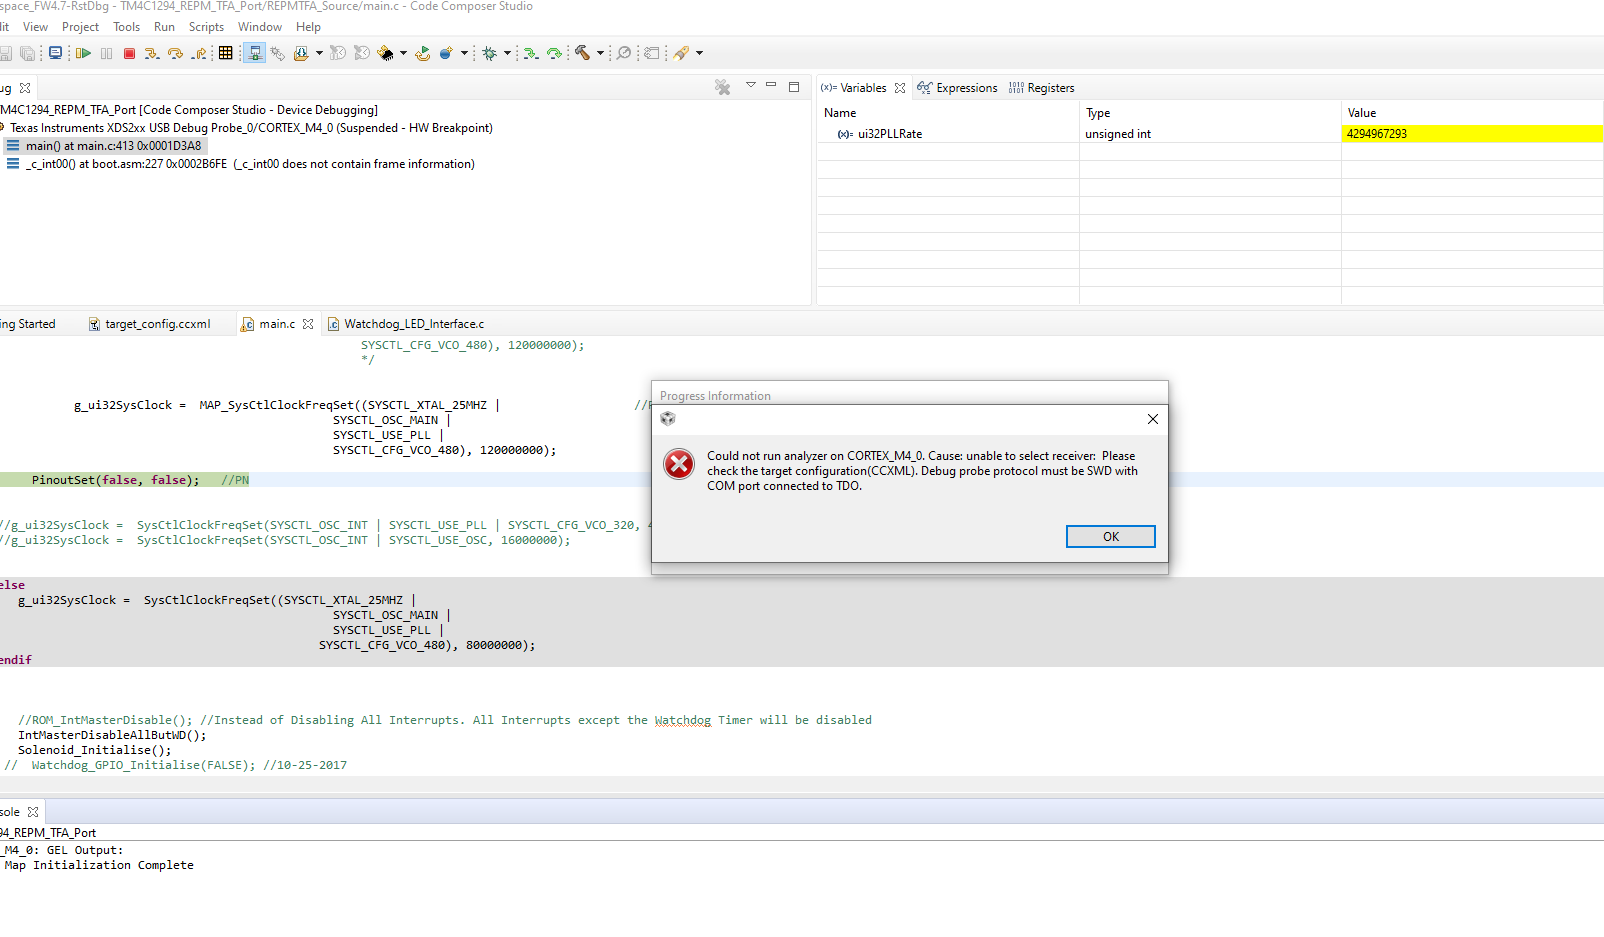
Today, it would not start again on the workspace that worked yesterday. Can you explain what this message means?
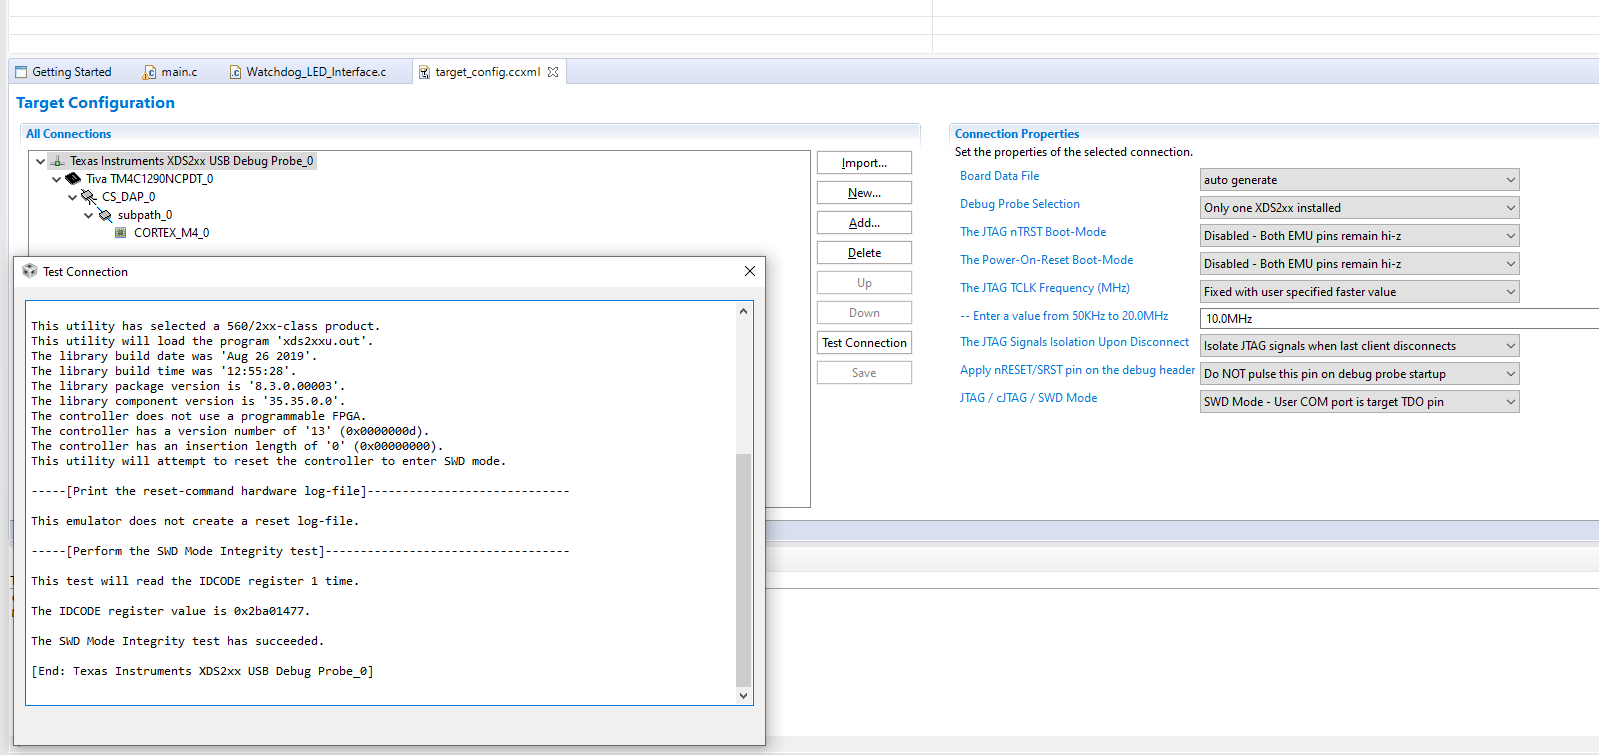
I have also attached trace logs of the problem condition. Can you please review and explain what is causing this inconsistency?
I need help getting this tool to work consistently.
Priya
The screenshot does show that "SWD Mode - User COM port is target TDO pin" has been selected in the target configuration.Priya Nadathur70 said:Yes, this menu has been confirmed several times, I am set at JTAG SWD mode.
The 7737.file.log debug server logging attached to the first post contains the error:
0x000009EC 106549 3 XPCOM R: ( (dsIBreakpointException*)0000015F16B0E708 )->getExplanation( *0000003A202FDBE0 = unable to select receiver: Please check the target configuration(CCXML). Debug probe protocol must be SWD with COM port connected to TDO. ) = 0x00000000
And there are lines which suggest that the user COM port has actually been set by the CCS debugger to be the UART rather than TDO pin:
0x00003534 71500 3 GTI C: JTAGData_AddVariableEx( 0000015F0C65A160, SWD.SWO_DATA, aux_uart ) 0x00003534 71500 3 GTI R: JTAGData_AddVariableEx( 0000015F0C65A160, SWD.SWO_DATA, aux_uart ) = 1
Not sure if this is the indication of a problem.
Chester,
Thank you for your response. In the screenshot above, I tried changing the COM port to XDS200 Emulator CDC Serial port (COM4). But the debugger defaults it to COM5. I continue to get the error you highlighted in the log file.
Rafael--
This appears to be a tool chain issue. Not sure what I can do in the setup to change this?
Thanks,
Priya
Priya,
Priya Nadathur70 said:Yes, this menu has been confirmed several times, I am set at JTAG SWD mode.
The reason of my prior remark was that projects usually have their own .ccxml file per project stored in the targetConfigs directory - thus the SWO configuration may inadvertently change (I have done this many times).
Priya Nadathur70 said:This appears to be a tool chain issue. Not sure what I can do in the setup to change this?
Interesting. The COM port assigned for the SWO Trace is the one that corresponds to XDS2xx User CDC Serial Port (you can check this in your Device Manager). COM5 should be the correct value here.
As I mentioned at the end of my post in your other thread, can you try to erase the Trace temporary files and see if it flushes this erratic behaviour?
I am really baffled as to why you have been running into so much instability with this interface. I surely can't reproduce this here.
Hope this helps,
Rafael
Rafael-- I finally found the .TI-trace directory and deleted it. The hardware analyzer still gives the same error when I try starting a trace. It won't get the trace analyzer started at all.
Priya
Priya,
I get the same error message as your first post when my .ccxml configuration is incorrect. Otherwise, the Trace engine initializes properly.
If you don't get the trace analyzer even showing the main configuration screen, perhaps it is an issue with the workspace metadata. Can you check section 9.7.7 of the CCS User's Guide?
https://software-dl.ti.com/ccs/esd/documents/users_guide/index.html
I am still trying to reproduce the overall scenario of instability and will report back any findings.
I apologize for the inconvenience,
Rafael
Rafael-- I often delete the entire workspace and restart CCS to make this problem go away. I went to the dvt directory and deleted the Statistical Function Profiling directory. The same error still happens. Can this have something to do with the size of the application and what the debugger is able to handle?
I still have this in my main.c:
<?xml version="1.0" encoding="UTF-8" standalone="no" ?> <breakpoints xmlns:xsi="http://www.w3.org/2001/XMLSchema-instance" xsi:noNamespaceSchemaLocation="breakpoints.xsd"> <breakpoint type="Trace"> <property> <name>Hardware Configuration</name> <property> <name>Receiver Settings</name> <property> <name>Receiver</name> <string>SWO Trace</string> <property> <name>SWO Selection</name> <property> <name>Encoding Type</name> <string>UART</string> </property> <property> <name>Prescalar</name> <string>Auto</string> </property> </property> <property> <name>UART Options</name> <property> <name>Clock frequency</name> <string>Manual</string> </property> <property> <name></name> <string>120000000</string> </property> <property> <name>COM Port</name> <string>5</string> </property> </property> <property> <name>Timestamping</name> <property> <name>Resolution</name> <string>4</string> </property> </property> </property> </property> </property> <property> <name>Miscellaneous</name> <property> <name>Group</name> <string>Default Group</string> </property> <property> <name>Name</name> <string>Receiver</string> </property> </property> <enabled>0</enabled> </breakpoint> </breakpoints>
I have permission to send you the project if you can help find this persistent problem. Is there an email I can send it to?