This thread has been locked.

If you have a related question, please click the "Ask a related question" button in the top right corner. The newly created question will be automatically linked to this question.

CCS/TMS320F28388D: Compiler Option for Analysis of "callgraph"

Part Number: TMS320F28388D

Tool/software: Code Composer Studio

Hi all,

When I enable the compiler option of "Generated analysis info from profile data" as below: error occurs!

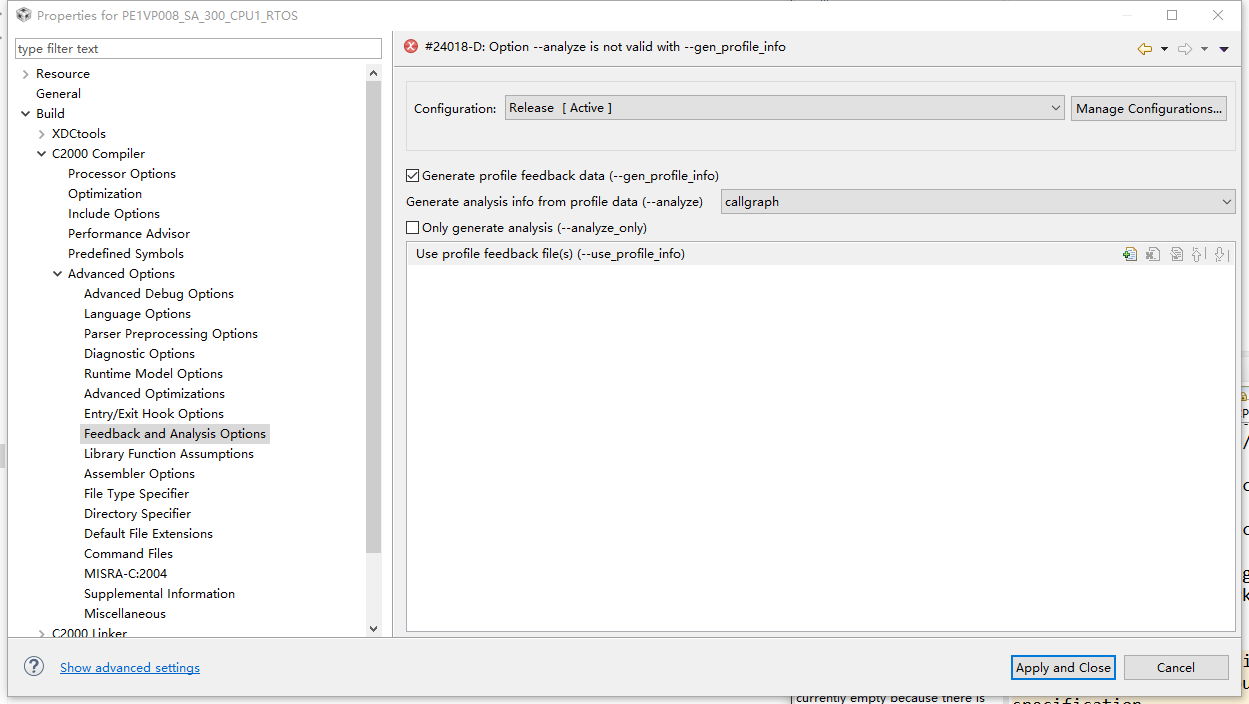
So what's the meaning of "Option --analyze is not valid with --gen_profile_info "? How can I get callgraph of my program?

Thanks a lot!

QL

  • Unfortunately, the C28x compiler does not support --analyze=callgraph.  I filed the entry EXT_EP-9752 to have this error corrected.   Feel free to track it with the link below in my signature.  The error begins in the compiler and automatically propagates into CCS.  

    user6114104 said:
    How can I get callgraph of my program?

    You can get a static call graph with the CCS menu selection View | Stack Usage.  Or, you can use the utility call_graph from the cg_xml package.

    Thanks and regards,

    -George

  • Dear George,

    I tried to use the utility caa_graph from the cg_xml_package, it throwed an exception like below:

    D:\ccs\workspace_v9\FEE\PE1VP008_SA_400_CPU1_RTOS\Release>call_graph PE1VP008_SA_300_CPU1_RTOS_linkInfo.xml | more
    Use of uninitialized value $str in pattern match (m//) at XML_TI_OFD.pm line 2204.
    Use of uninitialized value $targ_num in hash element at XML_TI_OFD.pm line 1354.
    D:\ti\ccs910\ccs\utils\cgxml\cgxml-2.61.00\bin\call_graph.exe Only tested for C6000, C5500, ARM, C2000, and MSP430 not: unknown
    Cannot find entry point.  Stopped at script/call_graph.pl line 994.

    When I tried to get a static call graph with the CCS menu selection View|Stack Usage, the result was empty:

    So what's wrong with me? Please help me for it.

    Thanks a lot!

    QL

  • I tried anothet way like this:

    D:\ccs\workspace_v9\FEE\PE1VP008_SA_400_CPU1_RTOS\Release>ofd6x -x PE1VP008_SA_400_CPU1_RTOS.out | call_graph
    Reading from stdin ...
    No .debug_info sections found. Stopped at script/call_graph.pl line 1102, <STDIN> line 1.
    

    It also stopped due to some reasons.

    Thanks!

  • The call_graph utility from the cg_xml package develops the call graph from the debug information.  The utility ofd2000 does not emit he debug information by default.  You have to add the option -g.  

    To see the documentation for the cg_xml package, please load the file install_directory/index.htm into a web browser.  

    Thanks and regards,

    -George