This thread has been locked.

If you have a related question, please click the "Ask a related question" button in the top right corner. The newly created question will be automatically linked to this question.

CCS/LP-CC2652RB: Realtime debugging settings?

Part Number: LP-CC2652RB

Tool/software: Code Composer Studio

Is it possible to realtime debug on this device? I would like to enter the program without reprogramming. I have seen the video on Using real-time mode to debug c2000 program in Flash the C2000 but the options are slightly different in my view.


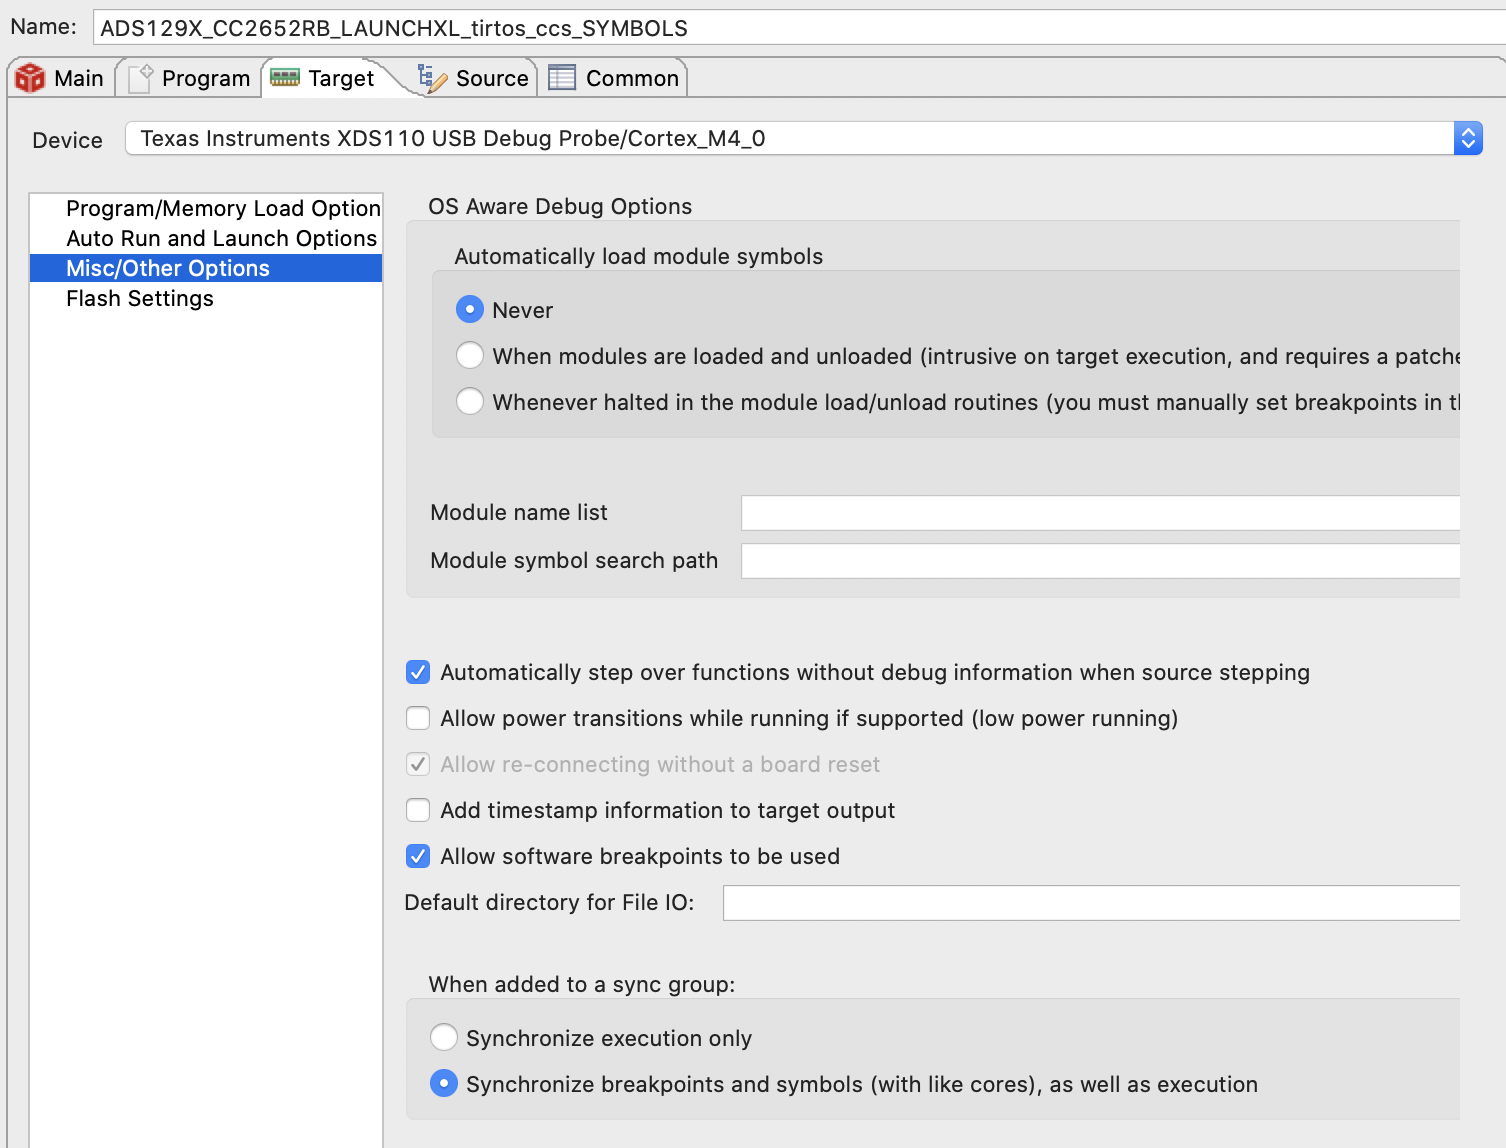
Under Program, I have checked "Load symbols only". When I run this debug configuration it halts my device, the red stop symbols appears in my debugger view, and everything is disabled under Run > Load.

  • Matt Gaidica1 said:
    When I run this debug configuration it halts my device

    CCS/MSP432P401R: Attach to a Running target without halting it indicates you should be able to disable the "Halt the target on a connect" option to keep the device running when connect.

    The DAP on the Cortex-M4 devices should allow 'real time' debugging by allowing access to peripherals and memory while the device is running. CCS does that on other Cortex-M4 device, don't have a LP-CC2652RB to try.

  • Hello,

    Matt Gaidica1 said:
    I have seen the video on Using real-time mode to debug c2000 program in Flash the C2000 but the options are slightly different in my view.

    Note that ARM Cortex devices does not have the same level of real-time debug support that C2000 has. On ARM Cortex, real-time debug support is limited to non-intrusive memory accesses via the DAP as Chester mentioned. C2000 offers additional real-time debug functionality such as non-intrusive access to registers while the processor is running, and being able to service interrupts while the processor is halted.

    Thanks

    ki

  • Ki, thanks, but I'm not any closer. I have "Halt the target on a connect" disabled. I cleared up some of my confusion by clicking on the core itself in the debug view. It still appears my device stops immediately upon debugging. If I click pause, then play, I can debug the program as expected, but I'm still left with a device that was reset. Ideally, I can enter a debug mode and observe how many times a counter has been increased after a week of running. 

    Here are all the tabs:

  • Matt Gaidica1 said:
    If I click pause, then play, I can debug the program as expected, but I'm still left with a device that was reset.

    I just created a new target configuration file for a CC2652RB1F, and found that a GEL file was specified as an initialisation script:

    Looking at the selected GEL file (C:\ti\ccs1011\ccs\ccs_base\emulation\gel\cc26x2.gel in a CCS 10.1.1 installation) it has the following:

    StartUp(int major, int minor, int patch)
    {
        /* Initialize memory map */
        memorymap_init();
    
        /* Debugger specific handling */
        if(GEL_MatchesConnection(".*TIXDS.*") == 1)
        {
            GEL_LoadGel("$(GEL_file_dir)/cc26xx_connect_util.gel");
            GEL_LoadGel("$(GEL_file_dir)/cc26x2_xds.gel");
    
            DefineResets(0);
    
            // Issue Board Reset to ensure device is in a known state
            // Note: If you want to attach to a running target without resetting the
            //       device, you must comment out the following 4 lines:
            if(!GEL_IsConnected())
            {
                GEL_AdvancedReset("Board Reset");
            }
        }

    If your target configuration is using that default GEL file, it would explain the source of the reset when connecting to a running target.

  • Chester, good find. That seems to be the issue. I'm not really sure the best practice to get around this, but my fix was:

    1. Duplicate that GEL-file into my workspace, hardcode $(GEL_file_dir) to the /gel location on my computer, and comment out the 4 lines it specifies to skip the reset.
    2. Create a new target configuration and specify my new GEL-file as the initialization script.
    3. In my 'load only symbols' debug configuration, specify the new target configuration in Main > Target Configuration > (set using Workspace button)

    Now, as long as 'halt target on connect' is not selected in the debug configuration, I can run it, right-click the processor and 'connect' to it, then Run > Load Symbols and set breakpoints as expected.

    Thanks!