This thread has been locked.

If you have a related question, please click the "Ask a related question" button in the top right corner. The newly created question will be automatically linked to this question.

TINA/Spice: Post processing curves when using parameter stepping

Other Parts Discussed in Thread: TINA-TI

Tool/software: TINA-TI or Spice Models

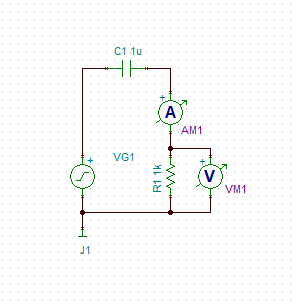
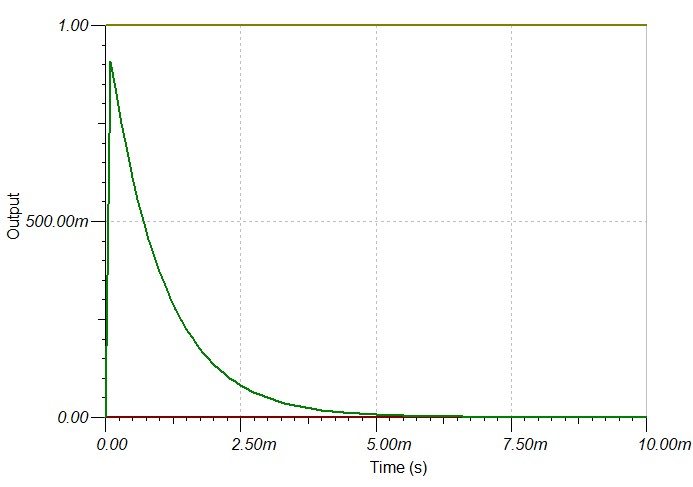
When doing a simulation with Tina-TI I am able to use parameter stepping to test a range of component values and compare results.

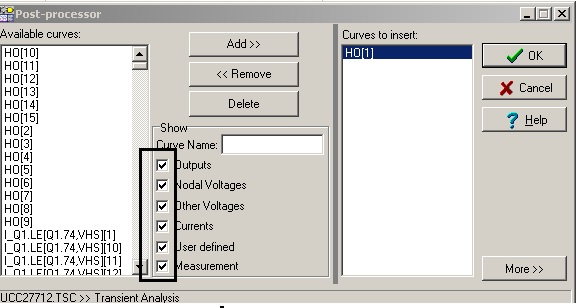
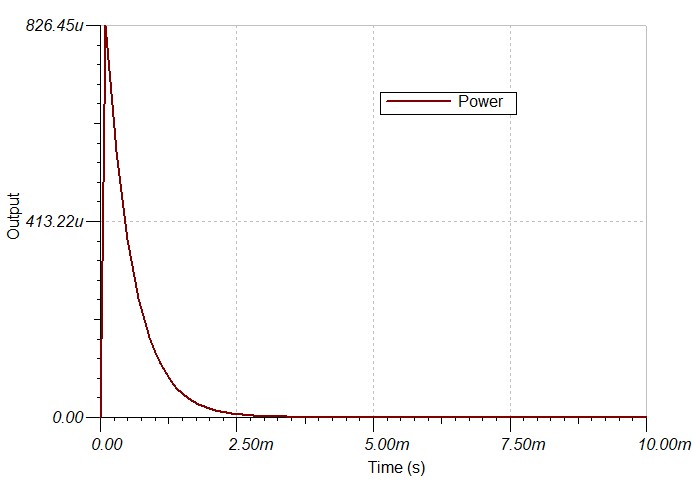
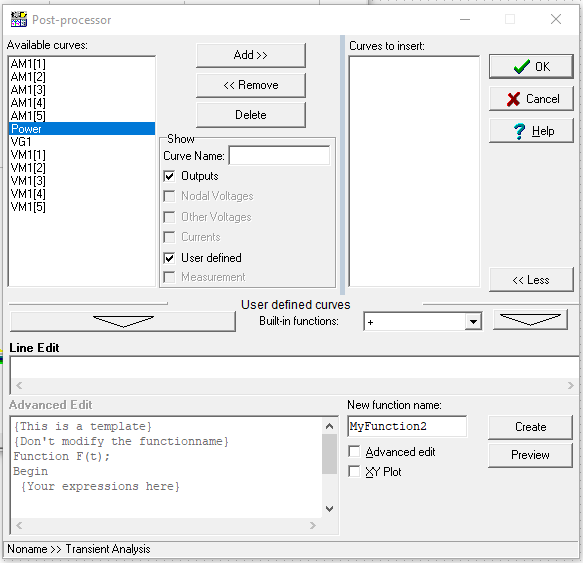
I can also create curves via post processing to provide more detailed information.

However I don't seem to be able to do both because of how Tina-Ti names curves when parameter stepping.

Are there any work arounds here?

  • Hi Hugh,

    We are looking into it.

    Best Regards,
    Ashis
  • Also as an additional side issue, is there any way to keep the axes fixed between plots without having to manually change them every time. Likewise is there a way to keep some output curves hidden (that are used as a source for post-processing).
  • Hi Hugh,

    1. Could you please elaborate your first question a bit more?

    2. To keep the axis setting fixed, go to TINA schematic editor, click on Analysis -->Options --> Tick Remember diagram settings.

    3.  To keep some output curves hidden, go to post processor window --> untick the the waveforms which are not required.

    Thanks,

    Somen

  • To make things a bit clearer here is a basic example of what I am after (not the actual circuit).

    Say I have my circuit.

    And I would like to do a transient response plot of the power dissipated in R1, no worries I can create a custom curve that is V*I.

    This will give me the below plot.

    I only want the power curve so I can go to view -> show hide curves and turn off everything except for the power curve, and then auto-scale.

    It would be great here if I could set up the post processed curves, and hide the ones I don't want and have it stay that way when I re-simulate the plot.

    Next up, say I wanted to step the resistance value of R1, I set it up, and then run the simulation. I then get an error AM1 unknown identifier.

    If I open up the post-process window it is pretty clear why, the curves are now indexed.

    How can I setup my post processor curve without having to do it 5 times, one for each index, even if I did create one for each index I would then need to muck about further if I ever changed how many parameter steps I was using.

    Is there any good solution here?

  • Hi Hugh,

    Have you tried to absorb the equations within the post-processor at the circuit level instead?

    For instance, you can use the "Power Meter" available at the meter tab of TINA. Also you can create you own equations contained within subcircuit and then create symbol as your own unique measurement device.

    Herman
  • Thanks, the power was more just a simple example to show what I was after. My main goal was to make it quicker/simpler to do LoopGain and 1/beta analysis, similar to in the linked question. I have been using the method as per your "8231.Design and Apps Current Sources.ppt" document.

    Would you have any examples you would point to on the process of creating your own component to do these sorts of maths functions?

  • Would you have any examples on this method?
  • Hi Hugh,

    you can use equation within vcvs such as

    .SUBCKT AVG VIN1 VIN2 VOUT
    E1 VOUT 0 VALUE = { ( V(VIN1) + V(VIN2) ) / 2 }
    .ENDS

    Herman