This thread has been locked.

If you have a related question, please click the "Ask a related question" button in the top right corner. The newly created question will be automatically linked to this question.

CC2642R: Exception triggered when debugging with JLINK

Part Number: CC2642R
Other Parts Discussed in Thread: SEGGER

Hello,

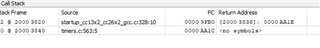
As previous thread I mentioned, I started  to use JLINK to debug on board with CCS. But something is weird: the program is stuck with exception, like faultISR, with more than 50% rate with debugging with JLINK, but I don't see this issue if I'm using the XDS100 debugger on evaluation board, even I tried to debug on evaluation board with JLINK, same issue happens. What I can conclude is this should have nothing to do with the program because it's working fine after power cycle without JLINK debug session.

Could you give me some hint what might be a problem?

Thanks,

Xiaofeng

  • Xiaofeng,

    I can't necessarily know what are the exact details about your setup but, as a general statement, the Debug Probe should not influence the normal runtime behaviour of your system.

    One common aspect that usually influences this is the reset/startup condition: the XDS-class of debug probes usually has five or six reset modes available through the CCS menu Run --> Reset, while Jlink has only two (maybe three) modes. If you are experiencing these faults after trying to run your code after a reset, it is possible the Jlink might not be fully resetting the device as the XDS110 would. To try to isolate this, you could try to disable the auto run to main() option in CCS, so you could always start at the reset vector and see where in the code the execution jumps to the Fault interrupt. For details on how to do that, check section 7.2.5 of the CCS User's Guide at:

    https://software-dl.ti.com/ccs/esd/documents/users_guide/ccs_debug-main.html#auto-run-and-launch-options

    I will try to think about additional aspects that could influence this and report back in case I find anything relevant.

    Best regards,

    Rafael

  • Hi Rafael,

    Thanks for your reply! And sorry for not clarifying the details: the program is not stuck at very beginning, actually it fails at the freeRTOS call "prvPortStartFirstTask". I did some debug with OZone, it shows it fails in timer task:

    I had thought it's caused by BLE stack, but it still has same issue even I disabled the BLE tasks.

    BTW, I also tried the way to ddisable "auto-check" in CCS, it got same result as OZone.

    Any idea about this?

    Thanks,

    Xiaofeng

  • Xiaofeng,

    Thanks for the additional details. The interesting aspect at this point is that the fault happens after the code initialization. I am not entirely sure what the FreeRTOS call does, but since you mentioned it fails on the timer task, I still suspect the timer was somehow not properly initialized.

    If you only see this behaviour with the Jlink, I still wonder if a complete cold reset (from power down) would clear this condition. The reason I mention this is because a number of resets do not initialize peripherals (timers, UART, SPI, etc.). Otherwise, I would have to defer this to someone in the software team that is more experienced in FreeRTOS and in particular in this API.

    One last aspect that can cause different Debug Probes to influence the behaviour of the target are of electrical nature. In other words, if the Jlink operates at a different voltage than the target, the device may either be improperly powered or be put in a somewhat unstable state. However, since it seems your device is properly powering up, I don't think this scenario is happening in your case but I wanted to mention this.

    I will try to think about additional aspects and report back in case I find additional aspects.

    Best regards,

    Rafael

  • Hi Rafael,

    Thanks for your detailed analysis. I kind of agree your guess on the reset with JLINK because even after this error reports with JINK, power cycle the device can always resolve this issue as long as the image is flashed correctly. I will try to check with Segger to see if they could provide some help on reset the board with JLINK.

    Best,

    Xiaofeng

  • One more test I did locally is to manually toggle the reset pin to ground to simulate the JLINK reset with ResetPin, the issue can be recovered after reset. And I tried to attach the board with JLINK, I can see the code can be traced as normal.