This thread has been locked.
If you have a related question, please click the "Ask a related question" button in the top right corner. The newly created question will be automatically linked to this question.
Part number : CC2340R5
CCS version : 12.6.0.00008
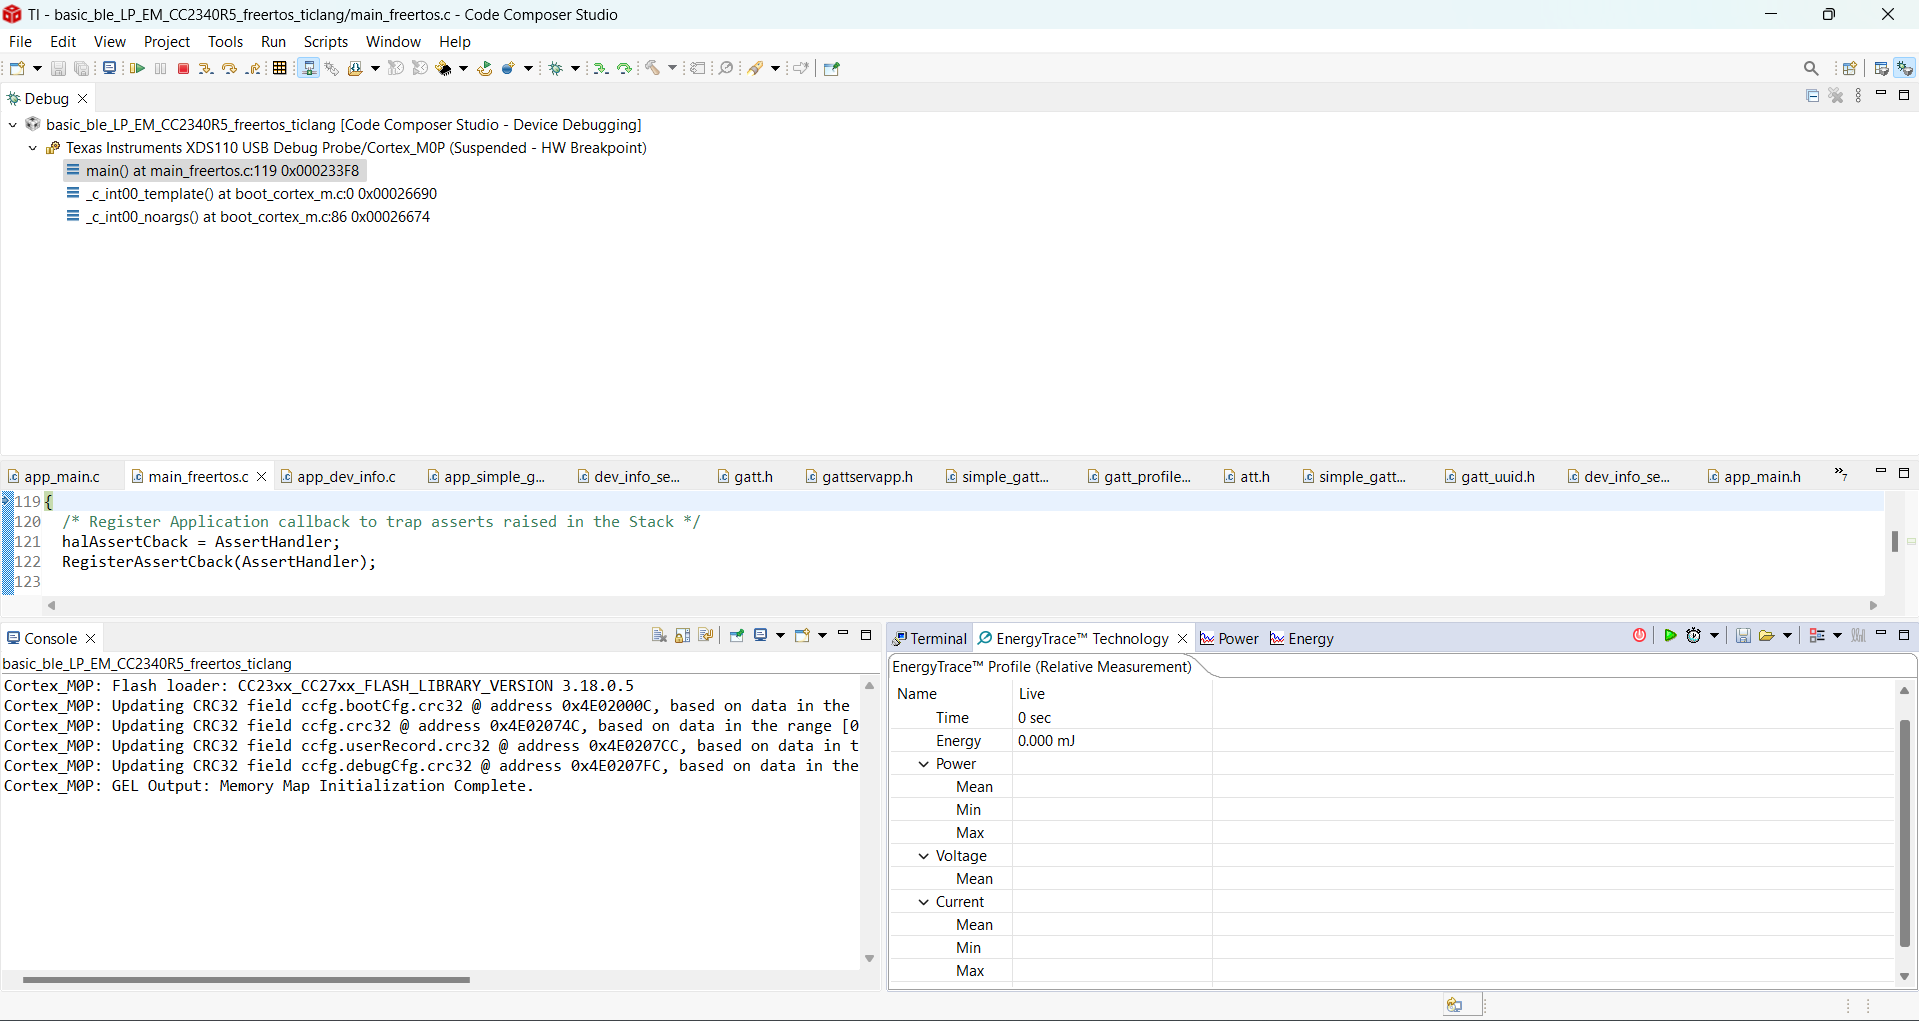
I'm looking to use Energy Trace to measure my application's current consumption. I followed the instructions in this document (https://dev.ti.com/tirex/content/simplelink_lowpower_f3_sdk_7_40_00_64/docs/ble5stack/ble_user_guide/html/energy-trace/energy-trace-cc23xx.html), but when I start capturing the trace, I can't seem to find the current graph (please refer to the attached image). How can I access it?
Additionally, I'd like to know how to open Energy Trace++. Could you provide guidance on that as well?"

Hello Navami,
Thanks for reaching out.
Is the graph you are referring to the one that shows the current consumption over time? I do not see a graph on the attached image.
One thing to consider is that power consumption is significantly increased while being in debug mode. The device should be flashed and power cycled before running power measurements. You can run Energy Trace outside of debug mode.
BR,
David.
Hi,
Please confirm: When I run Energy Trace outside of debug mode, I can see the energy and current graph (fig 1). Similarly, when I open Energy Trace with debug mode enabled, I can see the energy and power graph (fig 2). Is this correct, or am I missing something?


Also, how can I analyze these graphs? Can I observe different power transitions?
Hello Navami,
What you describe is correct.
What do you mean by power transitions? Are you referencing to the power levels the MCU works with?
May I ask what type of analysis are you looking for?
BR,
David.
Hello Navami,
cc2340r5 does not support Energy Trace ++, which allows you to see the different CPU power states you mention.
You could look into the power driver here to get information about the power states and transitions.
Hope it helps.
David.
Hello Navami,
You can run Energy Trace to see the current draw consumption of your device during runtime plotted against time, get power consumption metrics (max, min, mean current draw) and battery lifetime estimates.
BR,
David.
Hello Navami,
I am not aware of more recent accuracy measurements of Energy Trace other then the source I am sharing with you in this link. From my experience is it a very powerful tool, however when trying to profile very low current draw (less than approx 5 uA) it would be better to use a Power Analyzer.
Please also remember to follow the Energy Trace User Guide to make sure you are configuring the tool properly for accurate results. For example, just connecting the 3.3 V and GND lines between the XDS110 ETHDR and Launchpad is a very important step to get accurate values when aiming to observe low current draw.
BR,
David.
Hello Navami,
It is not a specific feature just a description of the tool. Please see the accuracy numbers for details. The cc23 family is also able to work with Energy Trace (however not with Energy Trace ++) as seen in the User Guide and here: https://www.ti.com/tool/ENERGYTRACE.
BR,
David.