This thread has been locked.

If you have a related question, please click the "Ask a related question" button in the top right corner. The newly created question will be automatically linked to this question.

RTOS/CC2652R: Code executions stops randomly

Part Number: CC2652R
Other Parts Discussed in Thread: BLE-STACK, UNIFLASH

Tool/software: TI-RTOS

Hello,

I too seem to be facing a similar issue to the related post :

https://e2e.ti.com/support/wireless-connectivity/bluetooth/f/538/p/795870/2948589#pi320995=2

The code executes indefinitely and then suddenly comes to a halt. It may take for like hours or at times maybe within an hour. I check to see if the stack is getting overflow ( which had occurred to me earlier). But this time, the stack usage of the tasks is less than 80%. The code does not get stuck in any infinite loop nor any spinlock situation which has been verified. 

The relating post mentions of doing many I2C_tranfsers, and my project does implement a lot of SPI_transfers. So I checked to see if any memory leaks may be causing this. That too was not the reason, since all of the mallocs are being freed properly and everything. 

What could be the reason then ? Could it be similar to the issue faced in the releating post - "data access error". If so, what could the possible reasons be for this ?

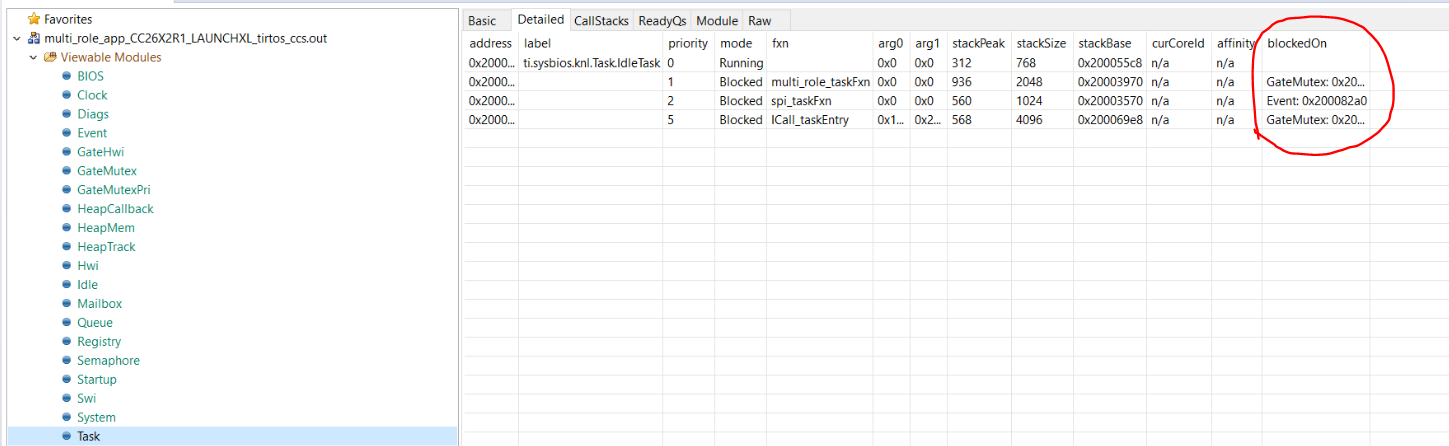
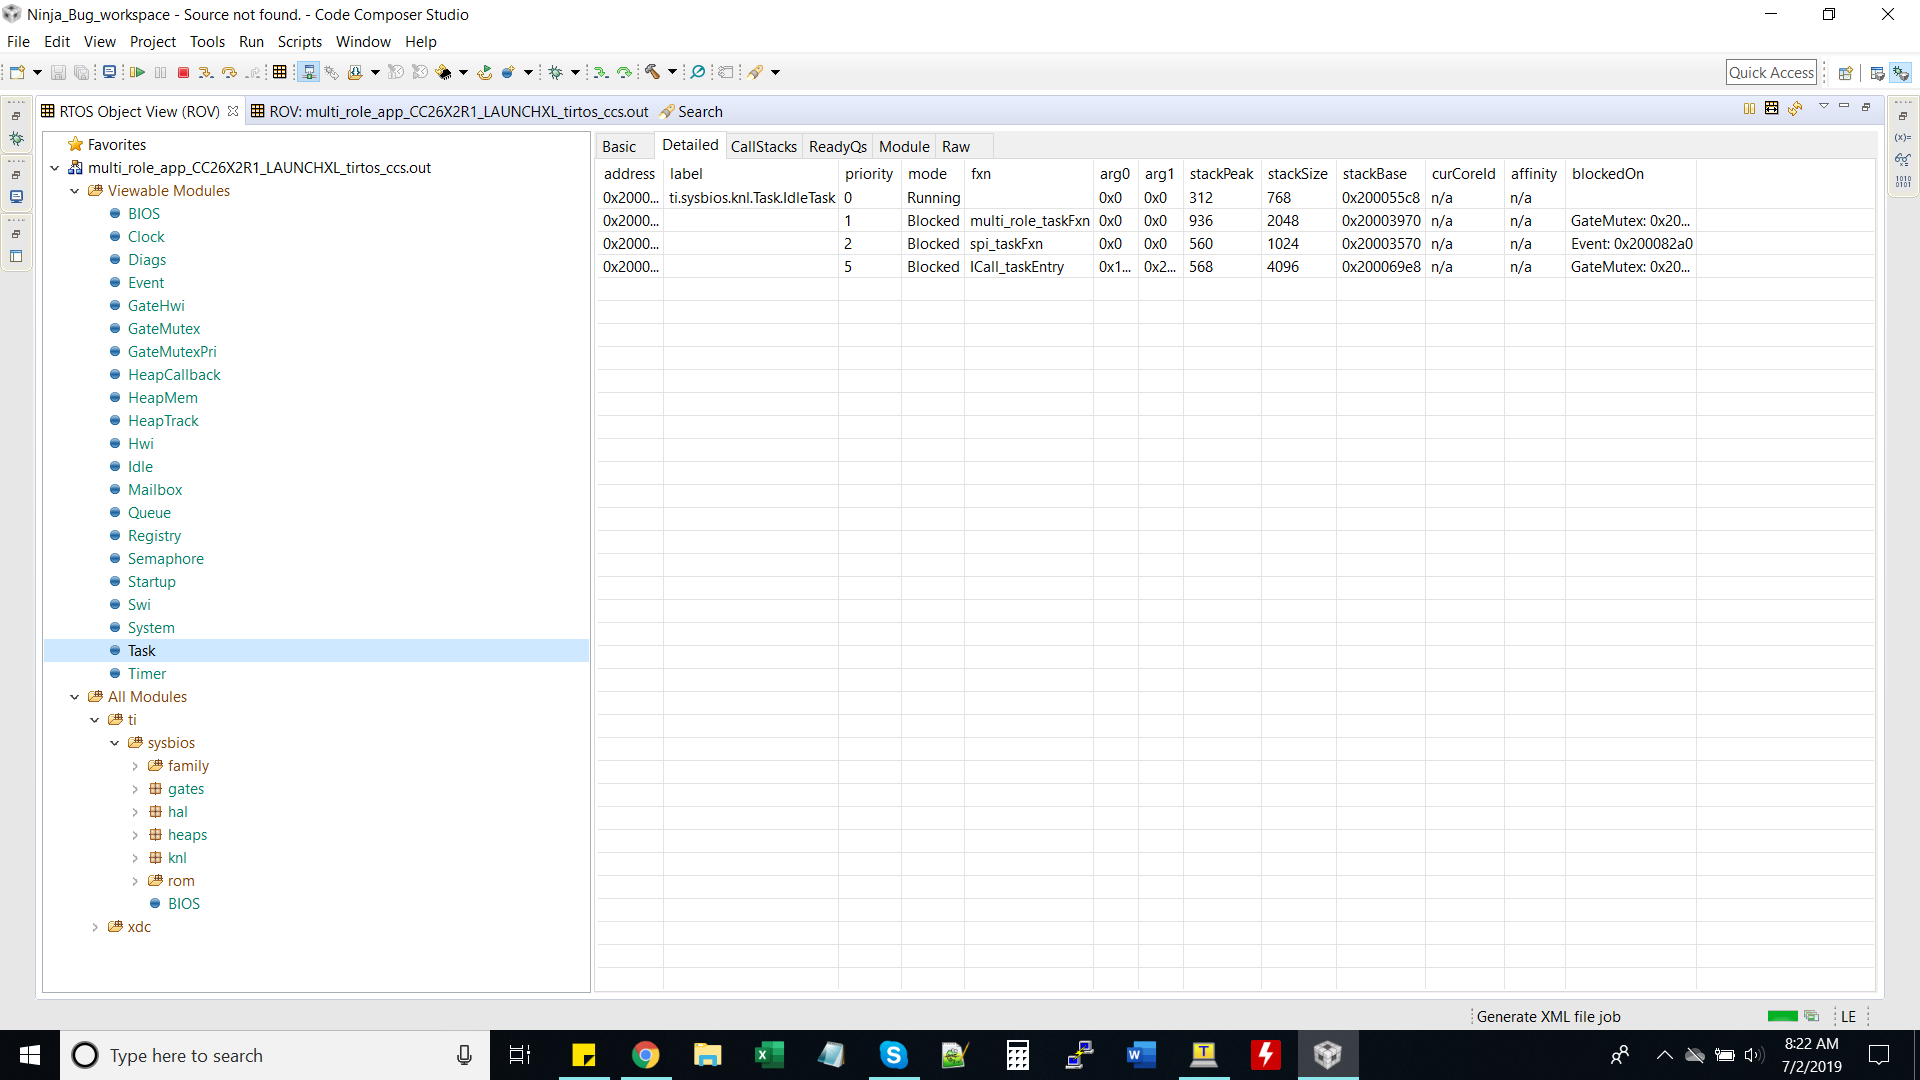
Could the number of Spi transfers be causing a Hwi stack overflow eventually a some point? I have put it to run in debug and with ROV enabled, but as it says it takes a long time for the "stopping" to occur. 


Regards,

Shyam

  • Hi,
    Which SDK version are you using?

  • Hello Joakim,

    I am using  SDK Version 3.10.1.11.

    The following one :- simplelink_cc13x2_26x2_sdk_3_10_01_11

    Regards,

    Shyam

  • Hi,

    Is there any way we can identify the cause if this issue without having to run it till it occurs again. I have set it to run for like 6-10hrs multiple times without getting the problem. Then I ran it overnight and when I checked it in the morning the issue seemed to come up again, but I was unable to identify the issue in the morning since the debugger failed to respond when I tried to in the morning for some reason.

    Regards,

    Shyam

  • Hi,

    Sounds like a runtime issue. If you are running on custom hardware it might be related to external crystals. Either way, please see this chapter in the UG for more debugging options: 

    http://dev.ti.com/tirex/explore/content/simplelink_cc13x2_26x2_sdk_3_10_01_11/docs/ble5stack/ble_user_guide/html/ble-stack-5.x-guide/debugging-index.html#debugging 

  • HiJoakim,

    I finally got the issue when running in debug mode after about 10 hours. But it seems there were no Exceptions in Hwi, No stack overflows - Task stack nor System Stack, it was not a loader_exit that caused the issue nor was it an XDC runtime error.

    When I opened the disassembly I got the execution halted at 0x1000060a. Then when I checked that location in the Memory browser it showed that the address refers to the abort instruction. I followed the debug guide entirely word by word. But it seems the cause of the issue is none of those.

    None of the HAL_ASSERT Prints in the assertHandler() came up either. However I am not sure if the HAL_ASSERTS are enabled or whether it is still appAsserCb that is getting executed. If so, could this be the cause of the issue - a abort due to a HAL_ASSERT ? And in such a case would it exhibit the behaviour as described ? 

    Please have a look into the screenshots that I have attached here. 

    What could be causing the execution to go into abort then ? Is there any way we can find where this abort() was called from, without having to put it in debug for another 10-20 hours and hoping for it to get stuck again:)

    I tried to step over from this point to see what could be causing this issue. It seems it comes back to this point after executing a couple of instructions.DebugVid.rar I have attached a screen recording of the same. Please find attached.

    Kindly reply as soon as possible.DebugImgs.rar

    Regards,

    Shyam

  • Hi,

    I found that even if the code is executing fine and then we pause the debug session then too the execution does halt at 0x1000060a.  So I guess the execution halting there is not an error nor an abort() happening. Rather it is the norm. 

    But then what could be the reason for the code execution to stop without indicating any errors whatsoever. It does not go into any infinite loops nor any spinlocks since I have put indicators there - either LED blinking or printf logs on uart.

    Neither of my tasks get events to execute. None of my timers nor led indications get executed and no logs appear on UART once the code execution gets stuck. It is as though the events are not getting loaded onto the queue. But clearly, that can't be the case since I have timer events that should trigger regularly no matter what - and also these events get indicated by either uart logs or led indications.

    Regards,

    Shyam

  • Hi,

    It's hard to say what the culprit is without debugging the software. Are you using a custom board our launchpads?

    And you are certain that it's not SPI or I2C ending up in a wait state?

  • Hi,

    Thanks for the reply.

    I am using a custom board. But all the hardware designs have been verified according to the TI designs.

    The I2C is not being used here and all of the SPI related transfers are restricted to one task. Hence even if the SPI was stuck in a wait state, the other tasks should be running. Atleast the LEDs should be functioning from the other tasks. 

    Also the timer triggered events had to be happening, I guess.

    Regards,

    Shyam

  • Hi,

    As suggested if the execution was getting stuck somewhere in execution, then wouldn't the code go to that point during stepover ? As I had shown in the attached screen recording during stepover it does not go into execution anywhere else.

    But I did see the following in the Tasks tab in ROV . Actually, I think that the tasks should get blocked on EVENTs. But it appears the multirole task and Icall tasks are gettting blocked on GateMutexes.  Could that indicate anything related to the issue?

    I have not used any GateMutexes in the Application. I have used Semaphores.

    Regards,

    Shyam

  • Hello,

    I came across the following post :

    https://e2e.ti.com/support/legacy_forums/embedded/tirtos/f/355/t/265793?HeapMem-and-GateMutex

    It mentions of HeapMem using a Gatemutex by default. I do use mallocs in my application code. So could it be that an malloc is getting stuck or something ?

    Since the tasks do show being blocked on GateMutex.

    If so, why would it happen randomly out of the blue and what would be a solution to it ?

    Regards,

    Shyam

  • Hi Joakim,

    I finally found the error that causes the execution to get stuck.

    I enabled the HAL_ASSERT and got the HAL_ASSERT_CAUSE_ICALL_TIMEOUT error after nearly 16 hours.

    I understand from the debug guide that this error means "A stack API that was executed via ICall took longer than ICALL_TIMEOUT_PREDEFINE to return. This usually means that the stack has hung."

    But, how could this issue be resolved ? What could be its cause ?

    The following post mentions of the applications tasks not having a higher priority compared to the multirole task (which has the IcallDirect Apis) :

    https://e2e.ti.com/support/wireless-connectivity/bluetooth/f/538/t/688206?RTOS-LAUNCHXL-CC2640R2-Stuck-in-ICall-abort-with-ICALL-ERRNO-TIMEOUT

    Could that actually be the cause ? It does show a timeout of 5s and I would guess that my other task which mainly does only the SPI transfers would have completed in 5s time. Also from the Task tab in ROV that I had shared earlier, it does seem that the SPI_task with higher priority 2 is blocked on Event and the multi_role task and the ICall task seems blocked on GateMutex. 

    Regards,

    Shyam

  • Hello,

    Could I please get an update on this issue if anyone is familiar with it ?

  • Hi Shyam,

    I will assign this post to an expert to follow-up.

  • Hi Joakim,

    Thank you. 

    Regards,

    Shyam

  • Hello All,

    Can I just remove the HAL_ASSERT_SPINLOCK in case this HAL_ASSERT_CAUSE_ICALL_TIMEOUT is raised ? I mean if it is a timeout occurring as a one of case, then would this continue to work ?

    I really do not seem to understand in what case this timeout would occur. In what condition or scenario does this stack get hung for 5 seconds that it raises this icall_timeout ? 

    I am guessing the Icall_directAPIs would most likely be either a scan disable/enable or an avdert_enable/disable, since these are the calls that are normally executed at various intervals once the initializations are done. Anyways, I don't understand how this Icall_directAPIs can get blocked. The ICall task does have the highest priority of 5. It should not be getting pre-empted. Then how would these ICall_directAPIs be getting blocked or pended for in any case once I call them, let alone getting blocked for over 5 seconds ?

    I have 2 Application task - mutirole_task and an Spi task. As posted in my previous posts, when the execution stops due to ICALL_ERRNO_TIMEOUT, the spiTask is Blocked waiting for an event to occur. The mutlirole task and the ICall_taskEntry are both blocked on gateMutexes. Only the idle_task seems to be in Running state.

    I have seen multiple posts where such situations have been mentioned, but none of them seem to have posted a solution to it - most of them are just left inactive and without end.

    Regards,

    Shyam

  • Hi Shyam,

    I don't think it's probably that your problem is caused by ICall heap malloc, but to be sure you should use the HEAPMRG to check the heap when this happens: 


    You can read about HAL Assert here. It is certainly possible to ignore asserts, and we recommend this for products going into production.


  • Hello Marie,

    We have already been through the Debugging Guide. When the execution stopped, the tasks were having the following states. I got the same for another project as well. The application has not used any Gate Mutexes but the tasks show blocked on GateMutex. Could this be related to some setting that we have not done?

    And also both the projects, when execution stops, seem to have the multi role task and the Icall Task blocked on GateMutex : 0x20008c04.

  • Hi Marie,

    In the projects, I am using the Scan_disable and enable, as well as Advert_enable and disable at multiple points. 

    Is it required to wait for the GAP_SCAN_DISABLE_EVT to call the GapAdv_Enable ? 

    In both the projects,  I am calling GapScan_Disable and then GapAdv_enable without waiting for any events. Could that be the cause of the issue?

    .....Code Line 1......

    GapScan_disable()  //Line 2

    GapAdv_enable()  //Line 3

    ......Code Line 4....

    Regards,

    Shyam

  • Hi Shyam,

    Can you use the HEAPMRG to check the ICall heap when this happens: 

    Calling GapScan_enable() and disable and GapAdv_enable() disable shouldn't cause an issue in itself. Did you check out the Known Issues sticky post? We have a known issue whith the GAP_ADV_ENABLE_OPTIONS_USE_DURATION option. 

    e2e.ti.com/.../778168

  • And as always, to ensure thread safety, processing must be minimized in the actual callback and the bulk of the processing should occur in the application context. 


  • Hi Marie,

    Thank you for the response.

    Regarding GAP_ADV_ENABLE_OPTIONS_USE_DURATION , we are not using that option. Instead we are using GAP_ADV_ENABLE_OPTIONS_USE_MAX.

    Also, in the callbacks, only events are posted into the application queue and rest of the processing is carried out in the application context.

    Regarding the heap manager, we are using auto-heap size. I shall try out that heapmgr too. So as my understanding of the debugging guide goes, to enable the feature, we have to define -DHEAPMGR_METRICS in the .opt file. Then to view the heap variables, do I have to use the ICall_getHeapMgrGetMetrics(),  or can they be viewed in the 'Variables' tab in debug session ? Or would it be suitable if I used the ICall_getHeapMgrGetMetrics() in a watchdog callback and try to print out the values there ?

    I am using the OSAL_Heap. So if there were any overflow that occurred, wouldn't it have been notified by some sort of error message in debug console ? Also I am using the auto-heap feature, so wouldn't it allocate the required amount of heap ? Or is there a chance where the auto-heap feature might allocate a heap size that could be lesser than the actually needed size ?

    I have however, currently, put it in debug as said above.

    Regards,

    Shyam


  • Hi Shyam,

    You can add the HeapMgr variables to the `Expressions` tab in CCS to view them while in a debug session. 

    Per default, the BLE-Stack uses the ICall heap and it's also used for communication between the BLE-Stack and the application. Do you mean that you have configured a second heap (OSAL heap)?

    The auto-heap function allocates all your free RAM to heap, it doesn't know how much heap your application needs. Please see http://www.ti.com/lit/swra537 . There is no error message in the debug console if the ICall heap overflows. The closest thing would be ICall_malloc() returning fail statuses repeatedly.

  • Hi Marie,

    In the .cfg file for the multi_role example it is said that the default heap manager is OSAL_HEAP. In the .cfg file it is quoted as follows :

    " OSAL HEAP: legacy Heap manager provided with all BLE sdk. By default, this Heap manager is used. "


    That is why I mentioned of using the OSAL HEAP. I have not done any modification to configure another heap .

    And regarding the auto-heap feature, as you mentioned since the entire free RAM is allocated to heap, I guess in the event of an overflow, there would not be any option to increase the HEAPMGR_SIZE further, since already the entire free RAM would be allocated. Is that right ? 

    The link you have given "Please see http://www.ti.com/lit/swra537 ." does not open. It shows Error 404 : page not found.

    We have currently put the project in execution to check for the heap variables to see if there is in fact an overflow of the heap. We are running it by loading the .bin using UniFlash and have put a print of the heap variables  within the watchdog callback. Also we have put a print of these variables every 7 seconds or so on a UART and it seems the maximum memory in bytes allocated up until now has always been between 8k and 9k. Also the heap size allocated for the project currently running has been around 40k.

    Shall let you know when we get the issue.

    Thanks & Regards,

    Shyam

  • Hi Marie,

    I tried with the HeapMgr but the debug was stopped abruptly and the console showed "Unable to read a DAP Register".  So I ran it not in debug and put a Printf in the Icall.c file to know which Icall Service would be causing this ICALL_TIMEOUT. So, I got the service number as 16 and the ID as 268575353 . The following :

    ID = 268575353 Service = 16
    >>>STACK ASSERT
    ***ERROR***
    >> ICALL TIMEOUT!


    Could you please tell me what service the number 16 corresponds to OR rather the ID ? Like whether it is an Adv_enable or scan_enable or anything of that sorts ? 

    In the .map file it showed that the ID = 268575353 (0x10022279) corresponds to GapScan_disable. I've got the following lines from .map file of my project :

    FAR CALL TRAMPOLINES

    callee name trampoline name
    callee addr tramp addr call addr call info

    GapScan_disable $Tramp$TT$L$PI$$GapScan_disable
    10022279 0001affc 000009fc multi_role.obj (.text:multi_role_processAppMsg$5)

    What does the addresses mean ? Could I use them to know at what point in the code this issue was obtained ?

    and 

    GLOBAL SYMBOLS: SORTED ALPHABETICALLY BY Name

    10022279  GapScan_disable


    What does this mean ? What could be the issue of ICall_timeout to occur when GapScan_disable is called ?

    Awaiting reply soon.

    Regards,

    Shyam

  • Hello,

    On further debugging I found that during normal execution, the sequence of Icall direct APIs are as follows :

    1. GapScan_disable 

    2. GapAdv_enable 

    3. GapAdv_disable - This is done at the GAP_ADV_EVT_END 

    4. GapScan_enable - This is done at GAP_ADV_EVT_END_AFTER_DISABLE

    But when the ICall Timeout occurs, the GAP_ADV_EVT_END  is not raised after the GapAdv_enable(). It is not a stack overflow issue nor  a heap issue, since the heapstats showed there is atleast 20-30k of heap free.

    Now, what would be the reasons for GAP_ADV_EVT_END not to be raised ?

    Kindly provide reply.

    Regards,

    Shyam

  • Hi Shyam,

    1. What priority is the SPI task? If the SPI starves the BLE-Stack task or the application task for more than 5 seconds you willl have a problem.

    2. Are you trying to send only one Adv event? You should be able to do this more smoothly if you use the GAP_ADV_ENABLE_OPTIONS_USE_MAX_EVENTS option for GapAdv_enable().

    3. Did you try ignoring this error and running the application? Do you get any other symptoms?

  • Hi Marie,

    "1. What priority is the SPI task? If the SPI starves the BLE-Stack task or the application task for more than 5 seconds you willl have a problem."

    -- The SPI Task priority is 1.

    We did suspect that in the beginning when we had set the SPI task to priority 2 (i.e. Higher than the multi_role task of priority 1). But now we have changed the SPI task priority also to 1.

    "2. Are you trying to send only one Adv event? You should be able to do this more smoothly if you use the GAP_ADV_ENABLE_OPTIONS_USE_MAX_EVENTS option for GapAdv_enable()."

    -- We use the GapAdv_enable() to enable advertising and then Disable it at GAP_EVT_ADV_END. 

    "3. Did you try ignoring this error and running the application? Do you get any other symptoms?"

    -- By this you do mean removing HAL_ASSERT_SPINLOCK from the below :

    case HAL_ASSERT_CAUSE_ICALL_TIMEOUT:
    Display_print0(dispHandle, 0, 0, "***ERROR***");
    Display_print0(dispHandle, 2, 0, ">> ICALL TIMEOUT!");
    HAL_ASSERT_SPINLOCK;
    break;

    Am I right ?  If so, then No we have not tried ignoring this error and continue with the running of the application. 

    Regards,

    Shyam

  • Hi Shyam,

    Can you try running only one task per priority? (E.g multi role task on priority 2 and spi task at priority 1.)

    Yes I mean either configure HAL ASSERT to ignore or comment out that code line directly.

  • Hi Marie,

    From my last post :

    "We did suspect that in the beginning when we had set the SPI task to priority 2 (i.e. Higher than the multi_role task of priority 1). But now we have changed the SPI task priority also to 1."

    Initially we had set the SPI Task Priority = 2; and the Multi_role Task Priority = 1. Still we used to get the same issue. And now we are using the same priority for both the tasks.

    Regards,

    Shyam

  • Hello Marie,

    I had tried out your suggestions : 

    1. I had commented out HAL_SPIN_LOCK so that the execution resumes even after the error is raised.

    2. I used GAP_ADV_ENABLE_OPTIONS_USE_MAX_EVENTS to disable after a single advertisement.

    Still I ended up with the same error. And once the error is raised, even though the execution is not halted by HAL_SPIN_LOCK, the ICall_Timeout gets triggered for every Icall_directAPI - be it scan enable, disable etc. Advertising also does not work. And the device then halts execution completely.

    Is there any limit to the advertising or something ? Or is this related to any known limitation ?

    Regards,

    Shyam

  • Hi Shyam,

    Can you run with only one task per priority?

    Is it possible that the SPI task is starving the application for longer than the 5 seconds timeout?

  • Hi Shyam,

    Is it possible that the SPI task is starving the application for longer than the 5 seconds timeout? Can you use a logic analyzer or ROV to check?

  • Hi Marie,

    I am positive that the SPI task is not starving the application. Because, as I had mentioned in the previous psots I got the same issue with another project as well. And in that one, there is no other application task other than the multi_role_task (with priority 1).

    Both projects, however do follow the similar pattern of being in passive scan , then advertising a buffer of 68 bytes, every 250ms, disabling advertising at the GAP_EVT_ADV_END and enabling scan at GAP_EVT_ADV_END_AFTER_DISABLE. 

    Regards,
    Shyam

  • Hello All,

    Please do provide some solution to this issue. With all due respect, the past two weeks we have been discussing the same things over and over again. This is just not getting anywhere.

    I mean the GapAdv_enable works fine but at some point it just causes an icall timeout since it does not return. What could be the possible reasons for this to happen all of a sudden. The code follows the same execution and nothing else all the while ( like I mentioned in the last post). Nothing changes anytime during the execution and then why would advertising fail all of a sudden?

    Kindly provide some progress on this rather than suggesting the same thing over again. A reply a day is great but I believe things are not moving forward.

    Now, can this be identified as a ble stack issue and that the only resolution/workaround is to just do a watchdog reset.

    The code basically goes to passive scan  in coded_phy in the beginning, then when a timer of 250ms triggers it goes to advertise a 68 byte buffer, then at gap_evt_adv_end the advertisingn is disabled and at gap_evt_adv_end_after_disable the scan is enabled back again. This flow goes on continuously.

    Regards,

    Shyam

  • Hello All,

    Finally the issue was resolved. Apparently it was a bug with the Icall Task in the ble stack. The following post from  was the solution to the issue :

    https://e2e.ti.com/support/wireless-connectivity/bluetooth/f/538/t/626434?CC2640R2F-GAP-DeviceDiscoveryCancel-in-BLE-Stack-3-00-01-25-does-not-generate-GAP-DEVICE-DISCOVERY-EVENT-as-it-used-to-on-BLE-Stack-2-x

    In fact, Josh has already mentioned quite clearly that this is a bug in the Ble stack. But somehow, this issue has still not been clarified nor fixed. 

    I made the change as mentioned in the post and have put the code in execution for over 30 hours now, without ever getting the ICALL_TIMEOUT issue.

    I sincerely hope TI would make the correction required. Or atleast post this issue somewhere as a known Bug. It took a lot of time to reproduce the issue each time with every suggestion and it took even more time to finally arrive at the proper solution.

    Thanks a million to Josh Lubawy, whose post was most helpful. 

    Also thanks to the TI guys.

    Glad to have the issue solved. But please do make the corrections or provide atleast as a known issue in a post.

    Thanks and Regards,

    Shyam

  • FYI I had also posted again months later as a reminder to fix it, but never got a follow up:

    Hopefully it gets fixed this time.

    Thanks,

    Josh

  • Hello All,

    So I had assumed that the issue was fixed with the corrections mentioned in my previous post. But it seems I was able to recreate the issue again.

    When I had made the corrections from the previous post, I had also included a Display_printf to uart into the beginning of that function. Then it ran successfully for over 26 hours. Then I had removed that printf since I had put it there for purely debugging purposes. Now the issue of the ICALL TIMEOUT is back again. Now, this has to be some timing issue with the ICall msgs being put into the queue in the icall_direct api, shouldn't it ?

    Also there was the issue where the code execution just halted, with not even the Watchdog timer getting triggered. I have put it up as another post, assuming that it is a completely different issue.

    Regards,

    Shyam

  • Hi Shyam,

    From your debugging it sounds like you have some kind of timing issue or race condition, since it looks better when you add the display print call. 

    To be honest I think you may move faster forward if you use a watchdog reset when this happens.

  • Hi Marie,

    I had put the printf again (also including the fix that was mentioned earlier)and set it to run. Still, then after about 5 hours or so the issue was observed.

    So as you said there is some sort of a race condition or something going on I guess.

    So as you have suggested, would it be better to proceed using the Watchdog reset for now ?

    Hope you guys at TI would be looking into this issue further , if there is a timing or racing around condition occurring in the ICall task?

    Awaiting response.

    Thanks & Regards,

    Shyam

  • Hi Shyam,

    Yes I think it would be better to proceed using the watchdog reset.

    Since I am not able to reproduce your issue I can't really investigate further.

  • Hi Marie,

    Could you please tell me how you tried to reproduce the issue ?

    Basically, the device is in passive scan initially in CODED_PHY.

    A 250ms SW Clock is started in multi_role_init using the APIs from util.c. Which when triggered, the scan is disabled and a 68 byte data buffer is adverised.

    At the ADV_END Event the advertisement is disabled. 

    At ADV_END_AFTER_DISABLE the scan is again enabled.

    This loop continues indefinitely.

    Was the way you tried to reproduce the error, similar to this ? If not, could you please try it out ? I am sorry we are unable to share our current project since it contains our custom application as well. 

    Regards,

    Shyam

  • Hi Shyam,

    I have only tested the looping advertisement enabling and disabling. Can you make a minimal example for me that I can use to reproduce here?

  • Hi Shyam,

    Did you figure it out?

    I will close this thread due to inactivity.