This thread has been locked.

If you have a related question, please click the "Ask a related question" button in the top right corner. The newly created question will be automatically linked to this question.

CC2652R: Inquiries about SmartRF_Flash Programmer 2

Part Number: CC2652R

Hi, TI expert.

I have an inquiry about using SMART RF_Flash Programmer 2 at a customer company.

-----------------------------------------------------------------------------

[Symptom]

Step 1)  Download the test FW

Step 2) Test progress

Step 3) Download the mass production FW

-----------------------------------------------------------------------------

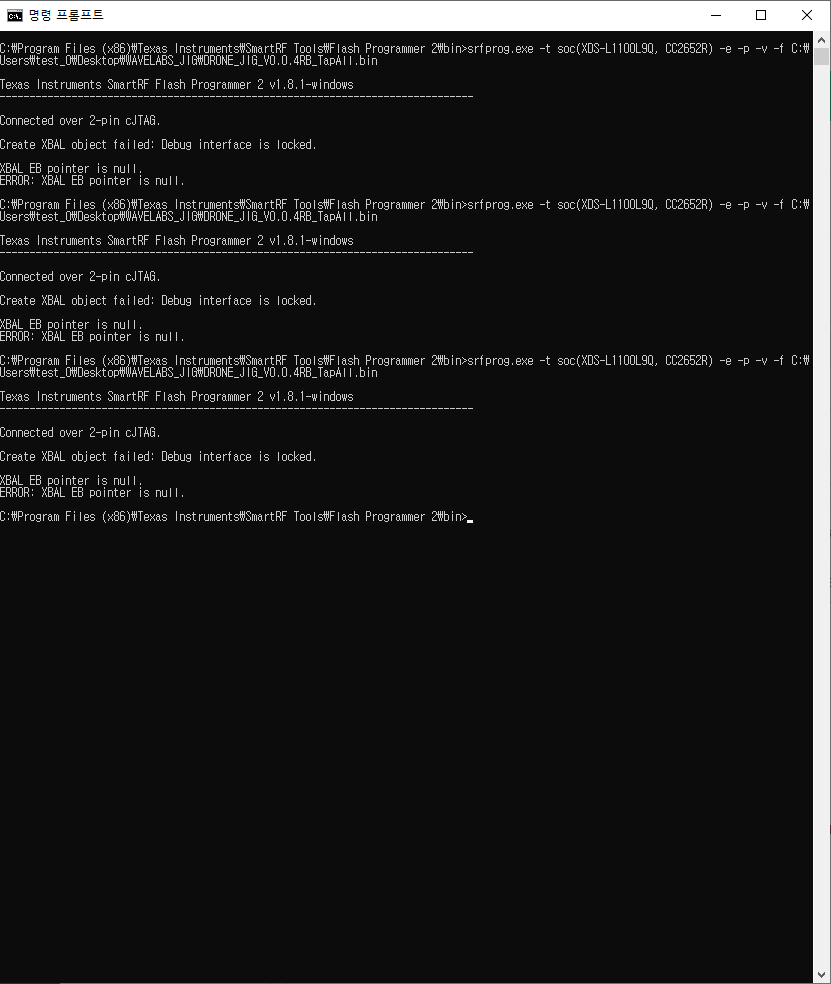
Currently, SmartRF_Flash Programmer 2-I have to proceed with the product shipment through the above process through CLI, but an error occurs after outputting the message "Debug Interface is Locked" in'Step 3'.

The symptoms are the same even if repeated several times. (Photo-1)

[Photo-1]

When downloading the SmartRF_Flash Programmer 2 program with the same FW, the message "Debug Interface is Locked" is displayed at the first attempt, but the download succeeds when it is repeated. (Photo-2, Photo-3)

[Photo-2]

[Photo-3]

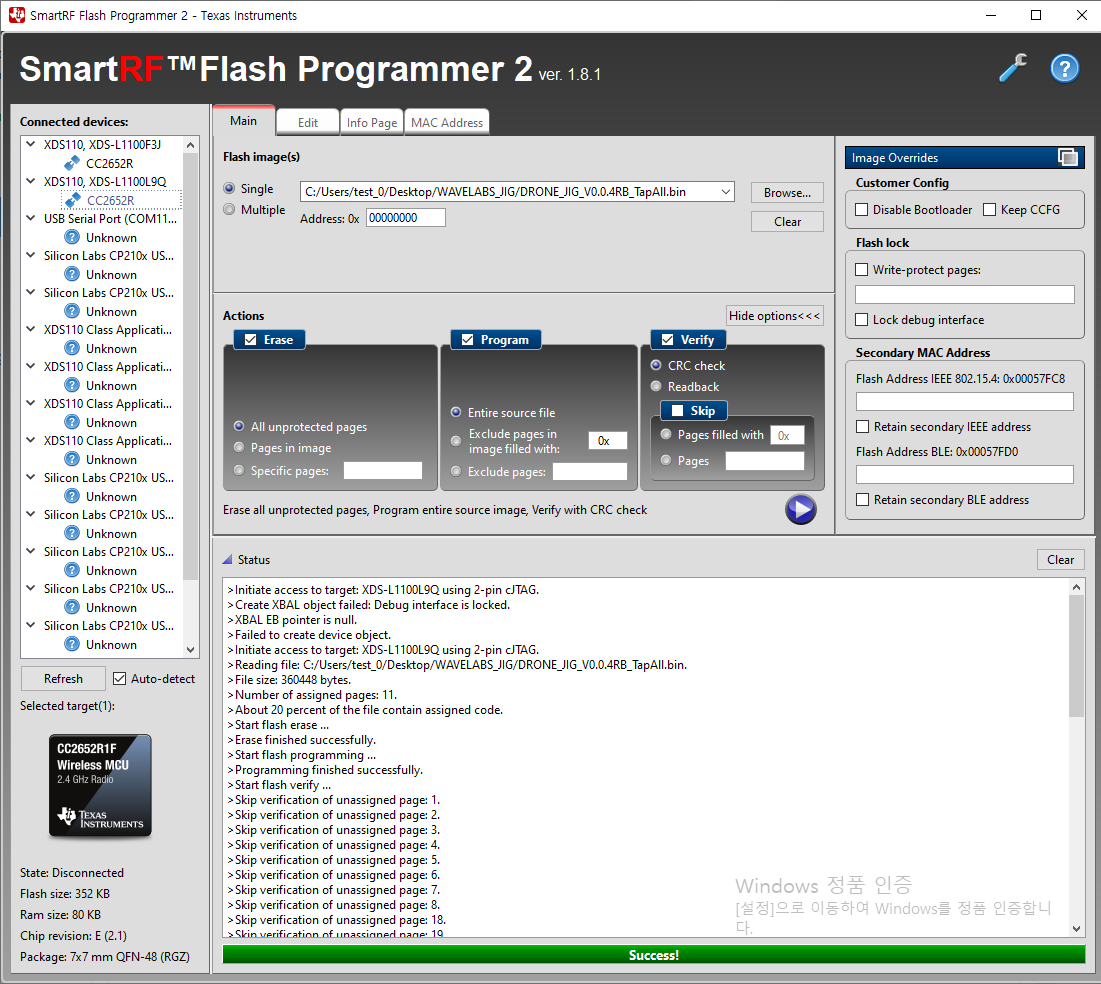
As an additional check point, the application confirmed that the CC2652R1 chip was detected (photo-2, photo-3), but the CLI cannot detect it (photo-4).

[Photo-4]

[Question]

Question 1) How can I download without a "Debug Interface is Locked" message?

Question 2) What is the cause of the difference between CLI and Application?

Please answer about my question.

Thank you.

  • Hi,

    The issue you are mentioning here makes me think to this one where the RESET pin was not properly used. Could you please verify if the same apply to you?

    Best regards,

  • Hi, Clement

    Thanks for responding.

    It is said that when downloading SMART RF_Flash Programmer 2, RESET was checked, and when performing CLI, it was confirmed that it was RESET.

    However, it is said that the above phenomenon occurs.

    Please answer the above Qustion.

    Thank you.

  • Hi,

    I have asked an expert to help you.

    Best regards,

  • Hi,

    Please apologize for the delay; were you able to find out the root cause of this?

    I am not very familiar with this tool, but usually any inconsistencies on the connection between the debug probe and the device can cause similar problems (more clearly seen in other tools such as Code Composer Studio, for example).

    That said, I see you have multiple USB interfaces tied to the same host, including an additional XDS110-based board. If you limit the number of peripherals connected to the host, does that help with the stability?

    Also, from the GUI are you able to read back the MAC addresses of the faulty device? If not, this would be an added indication the connection is unstable or faulty.

    One additional aspect is that, what does it happen if you load the corresponding .hex file instead of the .bin? Since the .bin is a bitstream without any memory placement information, anything on the lines could potentially write data in an invalid location. (I don't think this will severely influence this, but may be worth a shot).

    At last, I would definitely check the hardware troubleshooting section of the Debugging JTAG page below, which contains several possible scenarios and suggestions to fix that. I would pay special attention to any issues with flaky connections, ground loops and noise.

    https://software-dl.ti.com/ccs/esd/documents/ccs_debugging_jtag_connectivity_issues.html

    I will think of any additional scenarios and report back in case I find anything relevant.

    Hope this helps,

    Rafael