


Part Number: BOOSTXL-AOA
Greetings,
(1). As I can successfully get the raw data follow tutorial. I can plot waveform (amplitude of IQ complex data) over sample index like that in the tutorial, and I pick 16 packages and plot them. However, I notice the waveform in different packages are different, some of them are smilar to each other, but not all of them, where I expect all of them should be nearly the same.
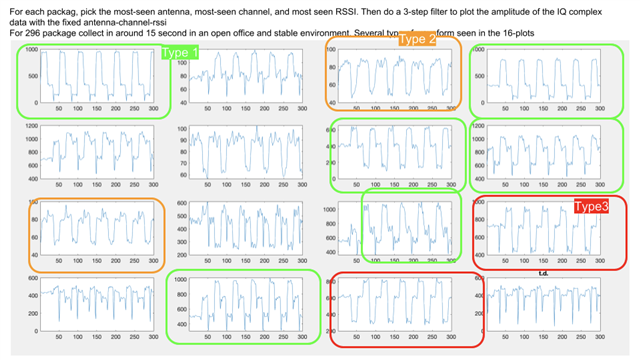
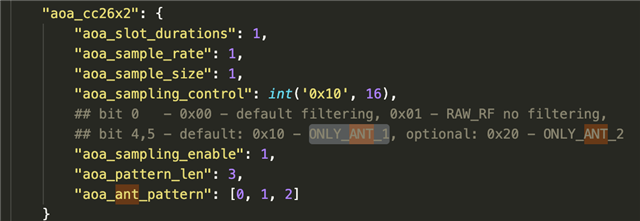
(2). also I did not seethe sine waveform, while it is said "...If there is no antenna toggling, then the I/Q samples will form a perfect sine wave. To prove it, change the antenna toggling pattern from 2 antennas to 1 antenna(A1.2), and see how the I/Q plots look like. ..". In the code I fixed as antenna 1 only
Are these normal Clément. Correct me if I am wrong. These. csv and its .mat is shared at [link]
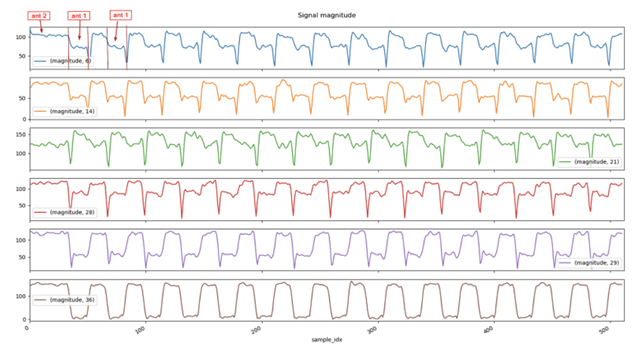
More over, (3) I also see different shape of waveform in tutorial, what does legend (e.g. `magnitude 6`) mean? Does that mean different packages number?
Best
Jet

