This thread has been locked.

If you have a related question, please click the "Ask a related question" button in the top right corner. The newly created question will be automatically linked to this question.

TPS386040: How to read the Worst case device accuracy for voltage monitoring from datasheet

Part Number: TPS386040
Other Parts Discussed in Thread: TPS386000

Hi,

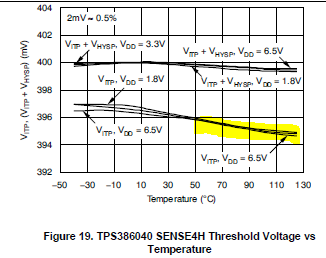
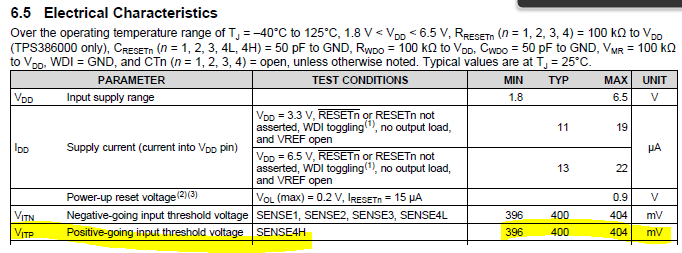
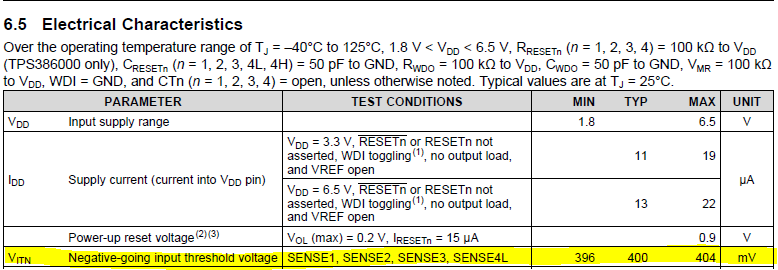
For TPS386000/TPS386040, when we refer '6.5 Electrical characteristics' in datasheet: it says VITN range as 396mV to 404mV for SENSE1, SENSE2, SENSE3 & SENSE4L.

when we see Figures 15, 16, 17 & 18, the range varies for each SENSE VITN. For ex: SENSE1 only varies from 0.3994 to 0.4004 over the complete temp & voltage range.

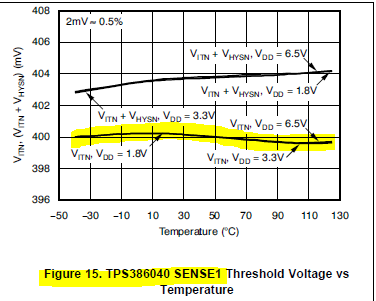
Which one should we refer for calculation for SENSE1 voltage? Referring the values in graph is sufficient for the complete operating range for SENSE1? Is anything missed out in figures?

Thanks in advance for your response.

Thanks & Regards

Muthu A

  • Muthu A,

    The EC table covers all devices across all operating conditions including temperature and is what TI guarantees. The Figure 15 represents a typical device and is only representing the average at a specific operating condition.

    Does this answer your question? When in doubt, always use the EC table to cover all cases.

    -Michael

  • Thank you Michael. I have some more queries. Please help with that.

    The Figure 15 represents a typical device and is only representing the average at a specific operating condition ==> Do you mean the EC table covers the part to part variations (including temp and voltage variations) whereas Figure 15 only covers the temperature (-40 to +125) and voltage ranges for a single device? I thought EC table gives the range collectively for SENSE1, SENSE2, SENSE3 & SENSE4L and for individual limits we need to refer the corresponding figures (for ex: SENSE1 --> Figure 15). Isn't it correct?

    In that case, VITP in Figure 19 for SENSE4H goes below 395mV as well. But the min value in EC table is 396mV. which one should we consider?

    Thanks in advance.

    Regards

    Muthu A

  • Muthu A,

    "Do you mean the EC table covers the part to part variations (including temp and voltage variations) whereas Figure 15 only covers the temperature (-40 to +125) and voltage ranges for a single device?"

    Yes correct. For absolute worst case, across all devices, across all operating conditions and temperature and lifetime variation, please use EC table. This is what TI guarantees for every case. For a typical device in general, use the approximation in the Figures.

    -Michael