A related question is a question created from another question. When the related question is created, it will be automatically linked to the original question.
If you have a related question, please click the "Ask a related question" button in the top right corner. The newly created question will be automatically linked to this question.
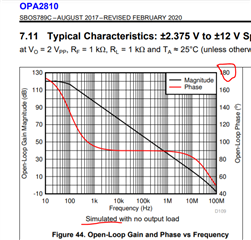
This curve is usually simulated from designer, the easiest way to set this up is with the V+ node grounded and run an inverting Aol test, that gives an initial phase of 180deg - just a small mistake I suspect,