Part Number: INA293
Hi team,
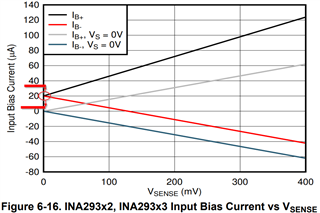
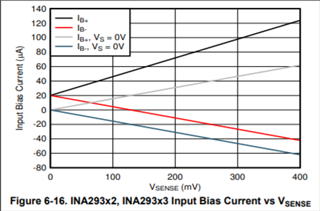
My customer wants to know how is the plot of input bias current IB+ and IB- look like when it's in minimum and maximum, because it seems to be only typical value as started from 20uA. If it's in maximum value, just offset +10uA the line is okay? (I saw the maximum value is IB=30uA on the table).

Regards,
Kazuto