Hi team,
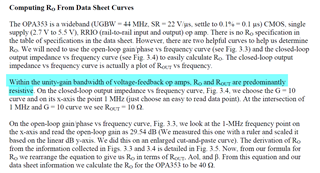
Following Tim Green's article in Operational Amplifier Stability, part 3 of 15,on the closed-loop output impendence VS frequency curve, FIG 20, we choose the G=10 curve and on its x-axis the point 0.8kHZ, at the intersection of 0.8KHZ and G=10 curve we see ROUT=0.5Ω.
On the open loop gain/phase vs frequency curve, Fig 15,we look at the 0.8KHZ frequency point on the x-axis and read the open-loop gain as 70dB.
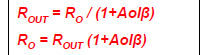
According to the above formula, we calculate Ro = 158 Ω.
we choose the G=10 curve and on its x-axis the point 100kHZ, at the intersection of 100KHZ and G=10 curve we see ROUT=10Ω. On the open loop gain/phase vs frequency curve, Fig 15,we look at the 100KHZ frequency point on the x-axis and read the open-loop gain as 30dB. According to the above formula, we calculate Ro = 31.6Ω.
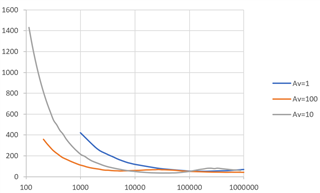
The calculated Ro, especially the low-frequency part, varies greatly, as shown in the figure above.
Is there any other prerequisite for the application of this calculation method? Or what causes this and which should prevail?
Best Regards,
Amy Luo