Part Number: TINA-TI
Is it possible to save the analysis graph plot settings so that each new analysis will use the same plot settings (specific curve, # of ticks, x-axis upper/lower limits, y-axis upper/lower limits, etc.)
At the moment every time I run a new AC analysis I have to redo all of the graph plot settings and deselect curves I do not want to see.
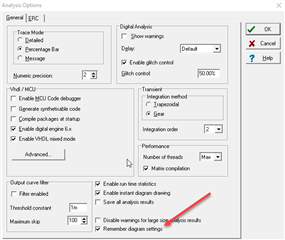
I do have "Remember diagram settings" enabled in the Analysis options.