This thread has been locked.

If you have a related question, please click the "Ask a related question" button in the top right corner. The newly created question will be automatically linked to this question.

OPA549: Inquiry

Part Number: OPA549
Other Parts Discussed in Thread: OPA445, OPA548, OPA544

Hi Experts,

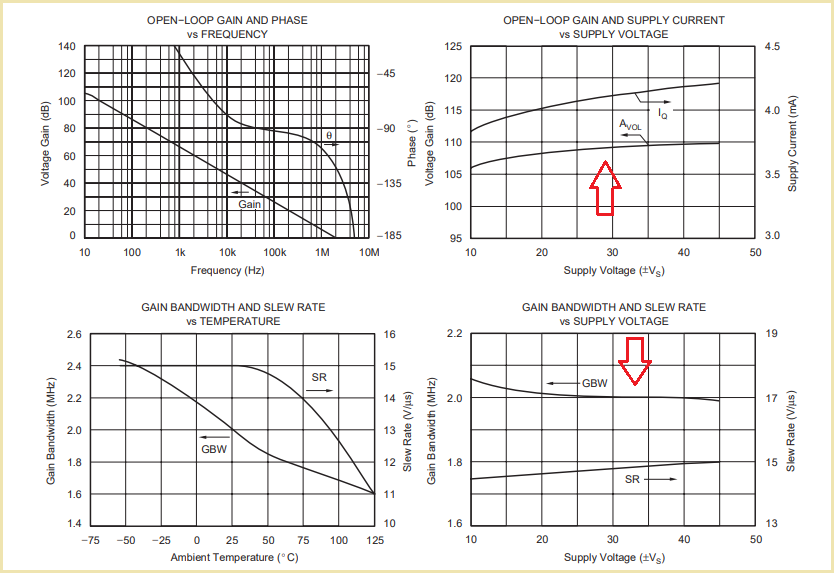
In the datasheet of this component there is an open-loop Bode diagram, page 4
Our customer would like to know how is this obtained (through simulation or there is a computation done)?

Kind regards,
Gerald

  • Hello Gerald,

    The OPA549 has been around for a few decades so it is not known to us exactly what was done during it development. However, the very likely order of events for developing the Open-loop Gain/Phase vs. Frequency graph was initially from simulations of the OPA549 IC circuit. That would be used as an initial verification of the circuit design. 

    Once the silicon silicon became available it is standard procedure to bench/ATE verify and characterize the electrical performances such as Open-loop Gain/Phase vs. frequency to assure they meet the defined expectations. That information is then used to finalize the datasheet graphs. Since variance is normal in semiconductor processing the graphs are targeted to represent a Typical device's performance.

    Regards, Thomas

    Precision Amplifiers Applications Engineering

  • Hi Thomas,

    I am sorry for reopening the thread and thank you for those information.

    Our customer need a clarification:

    He would like to know if the open-loop Bode plot chage when you use another value to supply the op-amp, OPA549?
    In the datasheet given the open-loop Bode plot for Vcc=+-30V.

    Finally, if you have another open-loop Bode plot for the OPA549, in your old files, with a different power supply, can you send me these plots?

    Thank you and kind regards,
    Gerald

  • Hi Gerald,

    the datasheet of OPA445 gives an idea about what's going on at varying supply voltages:

    Kai

  • Hi Gerald,

    No problem. I went back to the OPA549, 1997 design review to see if it had any information about an open-loop Bode plot vs. supply. It has a Bode plot simulation result, but doesn't include any supply information. Almost with certainty that simulation was done with +/-30 V supplies. We don't have archive information for the OPA549 so I searched for its closest related product the OPA548. It had two volumes of information that I searched through looking for Aol Bode plots vs. supply but again it looks like for the information was based on +/-30 V supplies. However, in general because of the circuit designs internal to an Op amp design the Aol Bode plot isn't overly sensitive to supply voltage. 

    I see that Kai has posted the Open-loop Gain (Aol) vs. Supply Voltage and Current for another TI power Op amp the OPA544. Even though the curves aren't directly applicable to the OPA549, I do think the range of Aol change vs. supply voltage about 10 dB is probable for the OPA549. The reasoning based on the OPA549 VS = ±30V and VS = ±5V curves in the QUIESCENT CURRENT vs TEMPERATURE graph under the TYPICAL CHARACTERISTICS graphs where the supply current drops about 5 mA for that supply reduction. A minor shift in the gain bandwidth is probable as well.

    Since most Op amp amplifier circuits operate with a closed-loop gain far below the Aol gain, the closed-loop gain error introduced by a small reduction in Aol will be very small. If the Op amp is operated with a closed-loop gain, then the gain error will increase with a lowered Aol. That is is because there is less loop-gain available to reduce the error.

    Regards, Thomas

    Precision Amplifiers Applications Engineering