A related question is a question created from another question. When the related question is created, it will be automatically linked to the original question.
If you have a related question, please click the "Ask a related question" button in the top right corner. The newly created question will be automatically linked to this question.
Funny you are asking for the THD+N vs Frequency plots. We are planning on some THD+N plots in the future. I believe I have a few preliminary THD+N vs frequency curves but they likely stay within the audio range (20Hz-20kHz). Give me a few hours to see if I can find it!
Is there a reason you need it to go out to 100kHz? Looking to use the OPA2992 in an ultrasonic application?
The application is a vibration analysis that extends a bit above the audio range. If all you had was frequency range results up to 20khz that would be helpful to see.
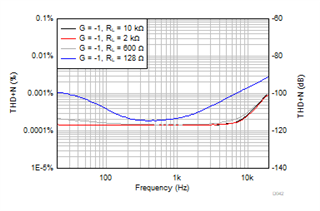
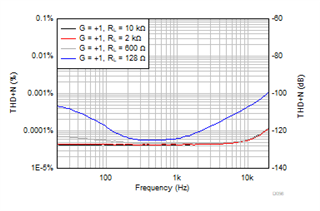
Sorry for the delay. Here's some data we collected. Just for the disclosure, these aren't official datasheet curves that come from the datasheet. The parameters are a supply voltage of 40V with an 80kHz bandwidth.
Hope this helps! Let me know if there's anything you need!
Sorry about that! They are a bit small. The one on the left has the gain = -1 with 10kΩ, 2kΩ, 600Ω, and 128Ω loads, while the one on the right has gain = 1 with the same loads.