Part Number: LM258
Other Parts Discussed in Thread: TINA-TI, LM358
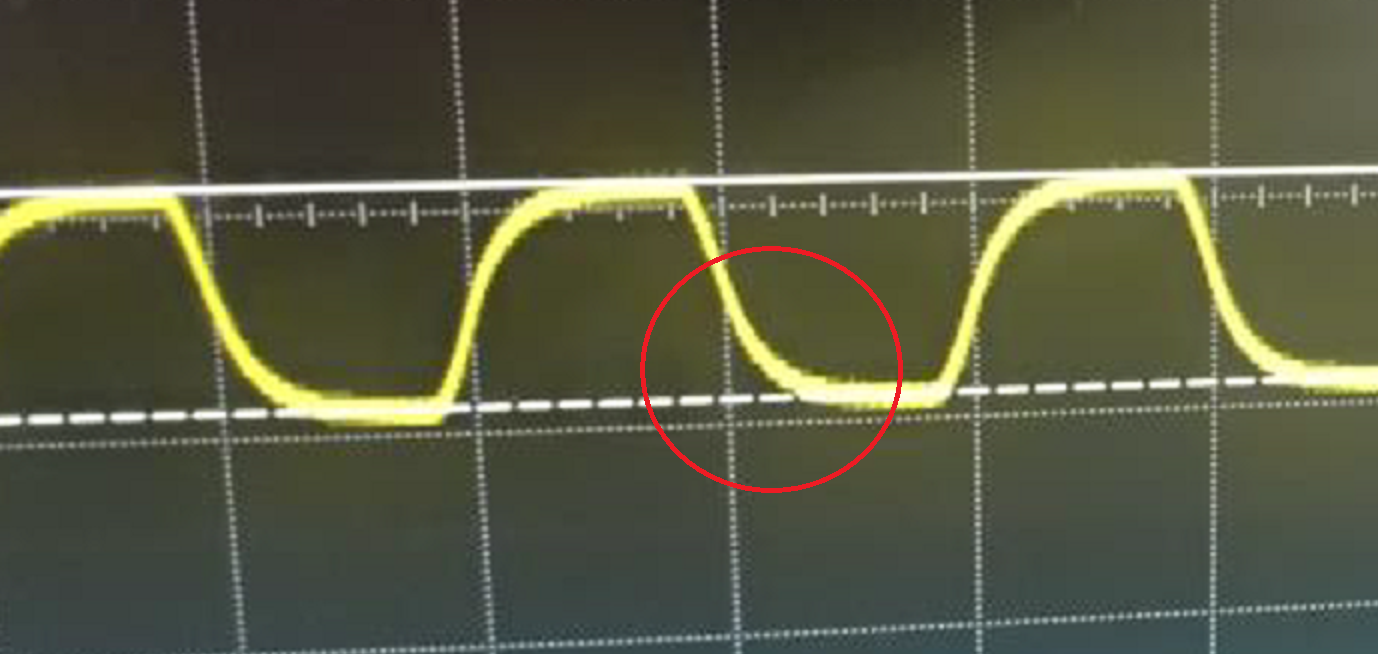
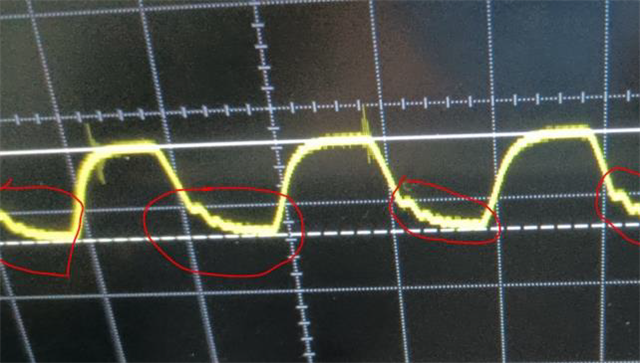
September 27, 2022------ Production testing of the Guangfo preprocessor found that the waveform of the front was jagged and there was waveform distortion.
NO.1 Abnomaly
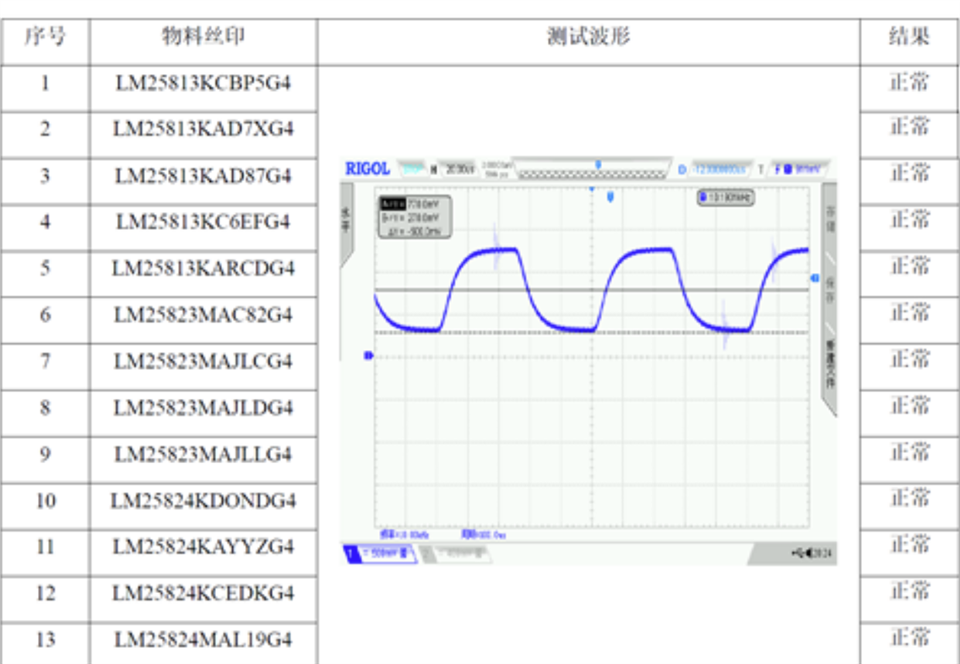
The R&D side continues to compare and analyze the test for this problem, and the test phenomenon is consistent with the production, and the detailed test data is as follows:
2 Analysis process
2.1 Design Validation
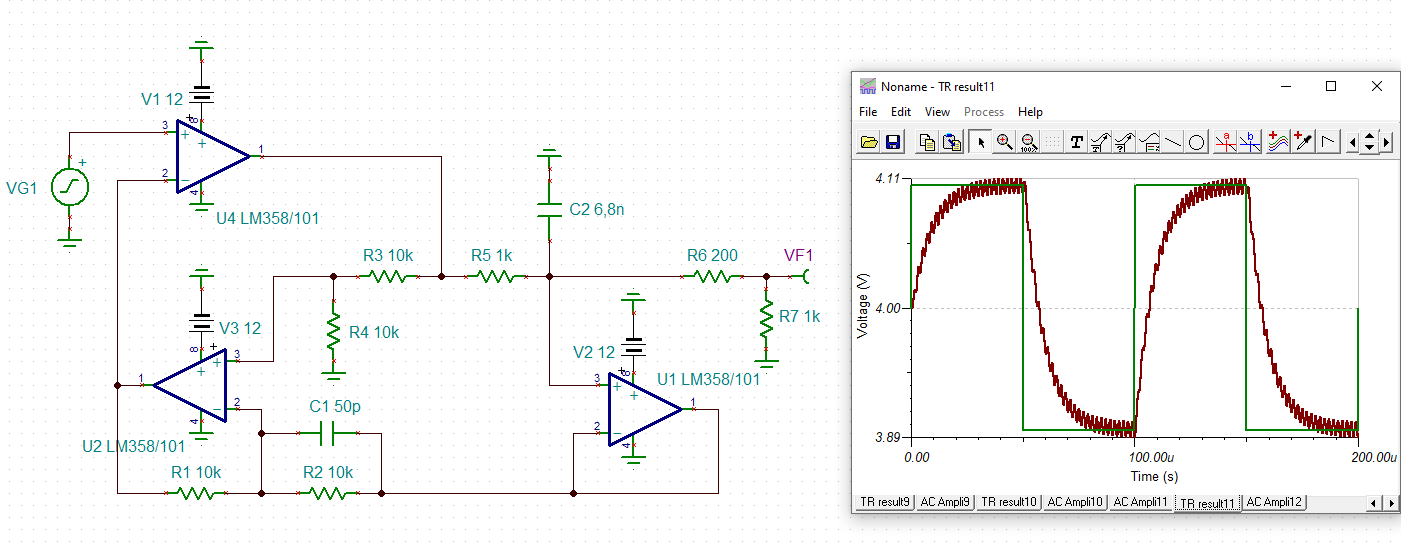
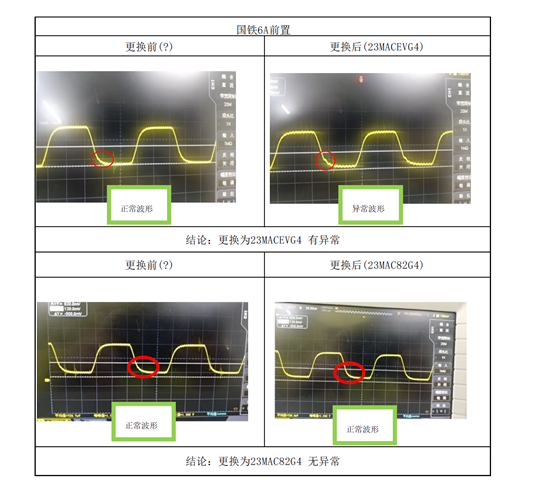
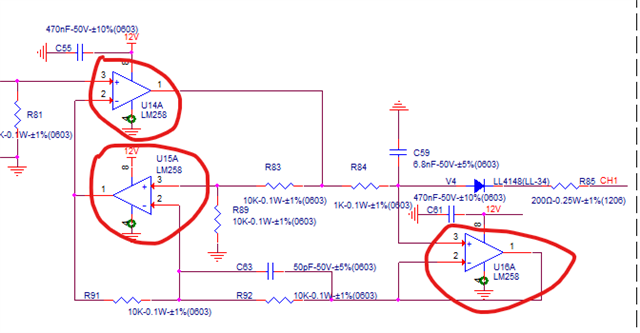
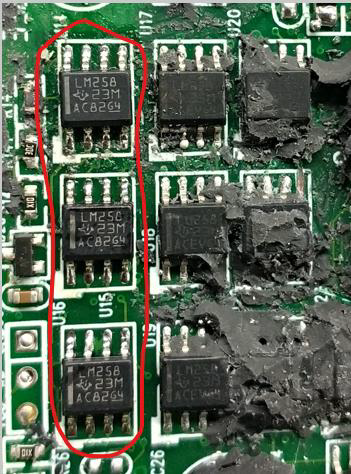
According to the design circuit, CH1, CH3 two-way pressure current conversion circuit op amp L258 (U14, U15, U16) is replaced, and the replaced waveform returns to normal.
Verify that there are no new materials and substitute materials in the BOM of the system, and there is no technical update.
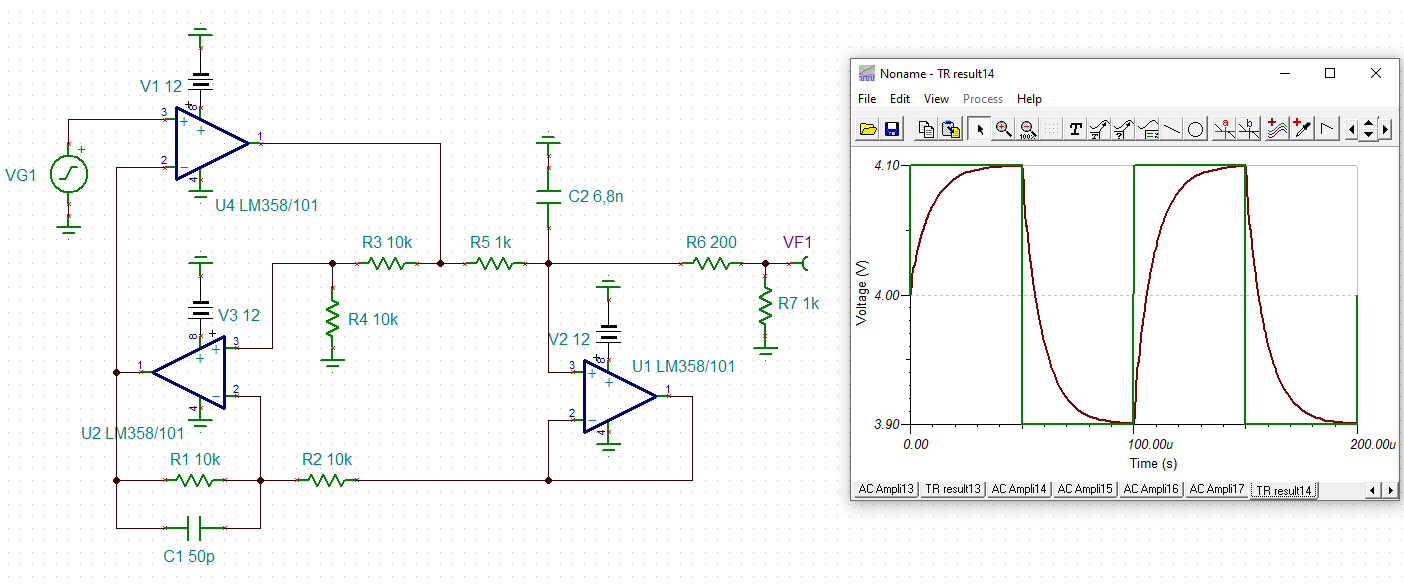
Waveform comparison before and after ,as follow:
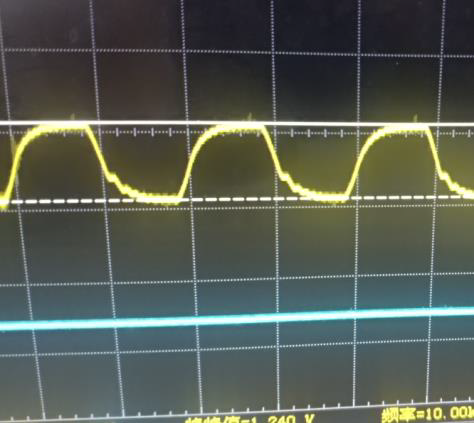
abnormal
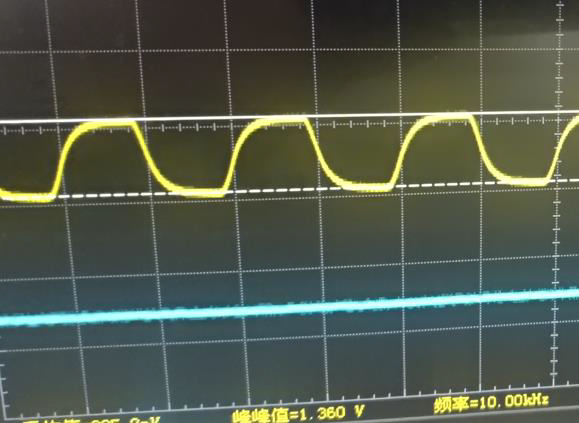
normal
PCB design
Acquisition range test
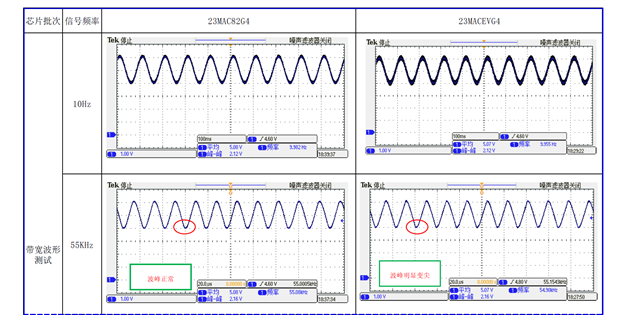
Walk-through vibration acquisition data requires input signal frequency less than 4 5 KHz is tested in two steps as follows:
1. Bandwidth test of the op amp itself
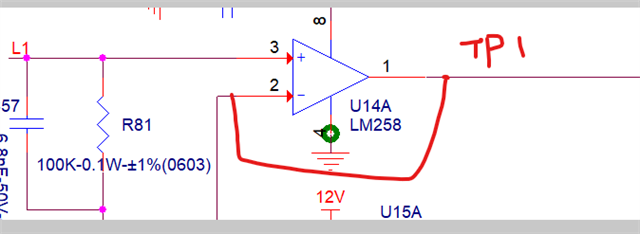
Build the circuit
U 14A is the voltage following output Disconnect chip 1, pin 2 and short, remove the capacitor L 1 input sine wave at the input of C 57
(Bias 5 V amplitude 2 V frequency 1 0Hz 60 KHz Test point waveform using an oscilloscope.) Detailed comparison of test data such as:
This is shown in Table 2
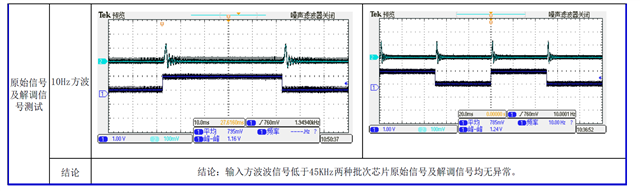
Raw signal acquisition and demodulation signal testing
Use two batches of op amps L258 (U14, U15, U16) to replace the front CH1, CH3 two-way pressure current conversion circuit, vibration signal,
Input square wave (offset 1.5V, amplitude 2V, frequency 10Hz), pre-connect to the iterative host, use an oscilloscope to test acquire the original waveform and Table 2 below shows the demodulation waveform and detailed comparison of the test data.
Sampling test is carried out for the raw materials 1001002193 the warehouse, 3 pieces of each silk screen are sampled and welded to the preprocessor, and the test data is as follows.
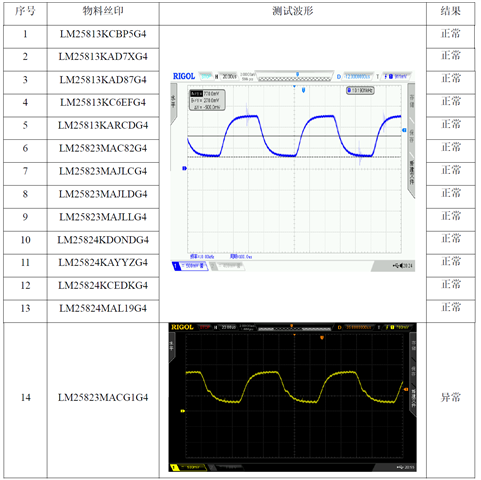
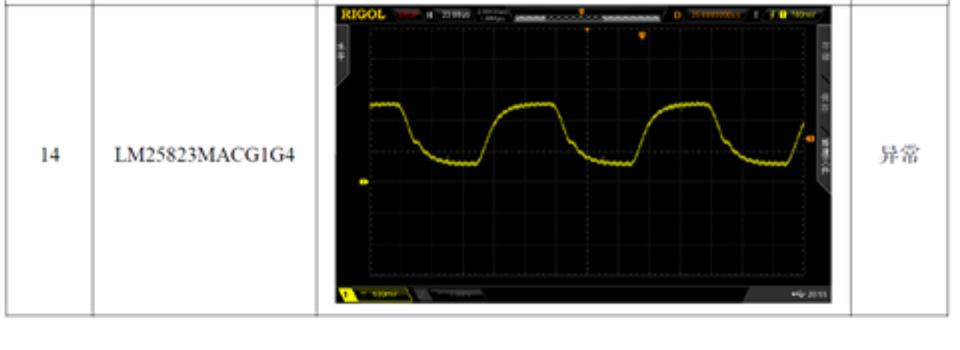
LM25823MACG1G4 abnormal
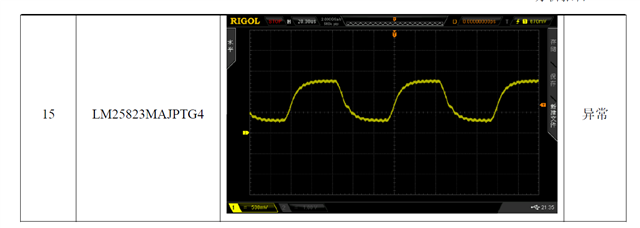
LM25823MAJPTG4 abnormal
The two 23MACG1G4 and 23MAJPTG4 silkscreen test waveforms in the test data are abnormal, and the previous 2 3MACEVG4 anomalies are one
, the rest of the batch waveforms are normal.
Conclusion
composed
THE ABOVE ANALYSIS DATA CAN CONFIRM THAT THE OP AMP SILKSCREEN IS 2 3MACEVG4 BATCHES OF OP AMPS AFTER EXCEEDING 5 0KHZ 6 0K HZ BELONGS TO THE OPERATION
THE NORMAL INPUT RANGE WAVEFORM OF THE AMP IS DISTORTED, AND THE OP AMP SILKSCREEN IS A NORMAL 2 OP AMP WAVEFORM OF 3MAC82G4 BATCH WITHIN 5 0KHZ
Both op amp outputs are normal Both meet the technical requirements of the walking design Abnormal waveform will not affect the function of the product itself Can be normal Use.
Please look for the cause of the exception。