This thread has been locked.

If you have a related question, please click the "Ask a related question" button in the top right corner. The newly created question will be automatically linked to this question.

INA239: INA239

Part Number: INA239


(1) when I use INA239EVM to measure current, the settings are as follows:

If the conversion time bit is set to 50us and 100000 sampling points are stored in excel, it will take about 5s. but i think excel stores100000 very quickly, and the time is less than 5s, So i want to ask INA239 how long is the interval between the two sampling points, and how do i store data in excel for a longer time.

  • Hello Zhao,

    Thank you for using the TI forum. Looking at your settings, you have conversions enabled for shunt, bus, and temperature, so it will be 100000 samples of each, and should actually take 15s to run....   The first issue I see is that there is not s settings for SW1.  This setting needs to match the physical hardware switch that is on the EVM.  If you reset the EVM and refresh the GUI with the EVM connected, then this value should be automatically populated. 

    If you only want the shunt conversion, then you may want to disable bus and temperature values (ie, change register 0x1 from 0xF000 to 0xA000). 

    The interval between sample sets is the value in the "Delay between samples" box, which will auto populate with the shortest delay to convert all data.  The screenshot of your plots page makes it look like the EVM didn't actually connect properly. Try going to "File -> Program Device..."  to make sure you are on the latest firmware.  To get data for a longer time, you can increase the value in the "#Samples" box. Unfortunately, that will be limited based on CPU resources.  If you need much more data, then you may need to use a custom interface with the EVM, such as LabView or any scripting tool that can read bulk data and send/receive serial commands then stream the data directly into Excel. There is a section in the EVM User's Guide that tells you how to communicate with the EVM without the GUI. This is section 4.2.4 "Direct EVM USB Communication".  

    Regards,

    Mitch

  • According to your instructions, I can run normally.

    I have questions as below:

    (1) the datasheet says the conversion time of ADC: 50us-4120us, whether 50us is the time required for each point acquisition.  if #samples set 100000,

    Does it take 5s to complete?  

    (2) delay between samples :0.05ms      Does 0.05 mean that after sampling 100000 points, the interval is 0.05 ,and then continue to sample the next 100000 sample set.

    (3) click save plot, and the data will be stored in excel quickly with 100000 points, which is far less than the theoretical calculation time. is it because adc first converts the data, and then reads it and stores it in excel at one time?

    (4) i want to know how much the max of sampling points

    thank you for your generous reply

  • Hello Zhao,

    Here are my responses to your questions. I also recommend looking through the EVM User's Guide, since it explains how the GUI works.

    1. Correct, if you are using a 50µs conversion time, and only have one conversion channel enabled (ie, only one of shunt/bus/temp), then it will take 5 seconds to collect the data.

    2. The delay between samples setting in the GUI is how often the GUI tells the MCU to read the register result values. So if you have the delay between samples at 0.05ms, and 100,000 samples, then it will take 5 seconds to fill the plot with data. If you want data in the plot as fast as the data is converting/available, then it makes sense to  have the delay between samples setting be the same as the device conversion time. This is why there is the "Auto Delay" feature. The auto delay sets the delay between samples to be the same as the conversion cycle in the INA. You really only want to change the delay between cycles button if you want data at a specific time interval, for example 100ms, or even 1s. (whatever is useful/interesting for your application)

    3. When you click the "Save Plot" button, it stores the data that is currently visible in the plot. That is why the data is saved quickly, because it has already been collected and is displaying in the plot. 

    4. There is no defined maximum value for the plots. It really depends on your system. If you try too large of a sample, then your computer memory may not be able to handle it all. If you try to read too fast compared to the number of samples, then the visuals may lag, but the data will show up still. You really just need to experiment with your specific setup to see what maximum value it can handle.

    Regards,

    Mitch

  • Thank you   very much  for Mitch`s answers to the previous questions.

    at present, i have used this tool well to measure power consumption, I have two questions need to specify with you . , thank you for your generous reply

    (1) the conversion time of ADC(50us-4120us) , i want to know what does the  different conversion time affect?     it is mentioned in the datasheet that is related to digital filter and effective resolution ratio, do you have any explanation about this problem.

    (2) INA239 have two voltage measurement ranges:163.84mV/±40.96mV,  for s system, there may be voltage measurements of different levels, if i use a mcu to control ADC from 40.96mv to 163.84mv , what is the response time of ADC, because if there is a large voltge measurement value,if the switch time is too long, the ADC may be damaged.(i know that i can use protection to prevnet ADC, i would like to know conversion time  from 40.96mv to 163.84mv by MCU command)

    happy thanksgiving day, looking forward to your reply.

  • Hello Zhao,

    Here are my responses to your questions:

    (1) The INA239 uses a delta-sigma ADC, which has a very high sample frequency. In this case, increasing the conversion time essentially takes more samples at the ADC and averages them together for a more accurate result. 

    (2) We do not specify the exact time it takes to make the internal change in the datasheet, however, the ADC will actually not be damaged with 163.84mV at the input when it is in the ±40.96 mV setting. Instead, the result values will just max out, and you won't get an accurate measurement. According to the datasheet, the absolute maximum differential voltage that can be put at the input before damaging the device is ±40V:

    Regards,

    Mitch

  • Hi Mitch

    thank you for explanation about previous question.

    (1)as you said, increasing the conversion time essentially take more samples for a more accurate result, can i know if  i set the conversion time to 4120us, the average of how many samples it is?  (  perhaps, it is related to internal filtering algorithm? ) 

    (2) the user guide show that  the ground of the INA239evm should be connected to the ground of the system under test.

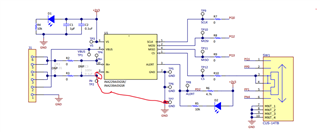
    if the  bus voltage of the system under test is very high, can i use IN- and IN+ to test small current, because the common mode voltage it can withstand is 85v. as below ,  can i connect the IN- to the ground of the EVM, i want to know this question for your point and suggestions.

    Best Regards

    yibo zhao 

  • Hello Zhao,

    Here are my responses to your questions.

    (1) The datasheet does not associate the conversion time with a specific number of samples from the ADC. This is partly because it is not a set number of samples, but samples over a set amount of time.  The exact number of samples could vary slightly based on variances in the ADC sample frequency. This is all handled internally.

    (2) Yes, this device can be used on the low side. Generally, if your BUS voltage is 85V or lower, then you may want to measure High side so you don't affect the load GND. Here is a video that explains some design considerations when choosing between high and low side: https://training.ti.com/ti-precision-labs-current-sense-amplifiers-design-considerations 

    Regards,

    Mitch