This thread has been locked.

If you have a related question, please click the "Ask a related question" button in the top right corner. The newly created question will be automatically linked to this question.

OPA828: Confusing plot in the datasheet

Part Number: OPA828

This seems to be a new plot, can't make much sense out of it, does the Aol polarity really change across temperature - surely not, 

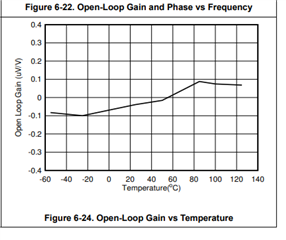
Being bounded by 0.1uV/V, I am interpeting this as the inverse of the DC Aol and it implies > 160dB Aol. 

The spec table is about 130dB type 120dB min  which would be the ATE limit. I am guessing this is a single part swept on ATE reporting measurement errors as I recall anything more than 130dB Aol was very hard to resolve. In any case, I would shuck this off into the useless plot category

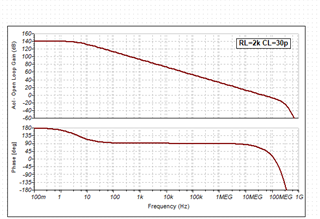
And as long as I am noting oddities, this Aol plot in the TINA rev C reference design has the Aol phase starting out at 180deg, normally that should be 0deg. 


  • Hi Michael,

    seems that the curve is slipped a bit?

    There's a nice thread about this topic:

    https://e2e.ti.com/support/amplifiers-group/amplifiers/f/amplifiers-forum/949431/opa2180-open-loop-gain-vs-temperature

    Kai

  • So yes this has come up before, having looking at this type of data a lot in ATE development, I understood this was being done in the servo loop environment where the loop forces the output over some swing and the input error voltage is measured as a measure of Aol. If you don't know that, the plot is very confusing - it is still very confusing showing a polarity flipping which is not possible. I know we ran out of measurement resolution above 130dB (sims vs ATE) and you a just measuring noise. Hence, I would have made this a simulation plot and reversed it to a dB over temp plot. 

  • Hi Michael,

    Yes, we have some artists working here...  that imply that at around 55C AOL becomes infinite :) 

    As far as AOL phase goes, as you say the phase shift would be starting at 0 at low frequency BUT we typically show a phase margin, which starts at 180 deg as shown in the simulation plot above - this way you may directly measure unity gain phase margin at the frequency where AOL crosses 0dB.

  • If you take these plots seriously, they are pretty confusing - And yes I understand rotating the sense meter to show phase margin, but in the TINA reference plots - you could have done the same thing to match the plot on 1st page of the datasheet, 

  • Yes, the AOL vs frequency plot in the datasheet shows phase shift while Tina simulation shows a phase margin. This could have been done more consistently but as you know datasheet is done by different team than Tina modeling. But as with many things in our field, one only needs to notice zero phase at dc to mean phase shift while phase of 180 deg at dc to mean phase margin.  However, I get your broader point - unfortunately, we are living in less than the perfect world.