Other Parts Discussed in Thread: OPA206
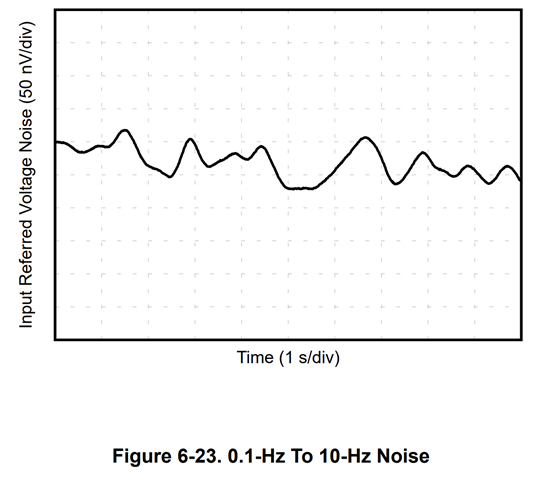
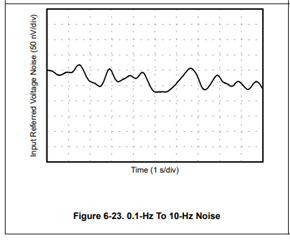
The Figure 6-23 0.1 Hz - 10 Hz Noise chart in OPA205 datasheet (SBOS962E - DEC 2022 Revision) looks weird. From the chart, there's no noise component near 10 Hz end. Could it be 0.1 Hz to 1 Hz noise instead?

This thread has been locked.
If you have a related question, please click the "Ask a related question" button in the top right corner. The newly created question will be automatically linked to this question.
Well Chia
This is sort of a classic datasheet plot. This done with the device in high gain mode followed by normally a gain of 100X active filter implementing a multiple pole 0.1Hz to 10Hz bandpass filter, then a 10sec sweep on a scope is done (measuring really pretty high Vpp noise) then that data is input referred dividing by the net gain in the DUT + active filter stage. This does not look as "noisy" as they usually do, kind of rounded off, but in case this is showing about 75nVpp which seems quite low,

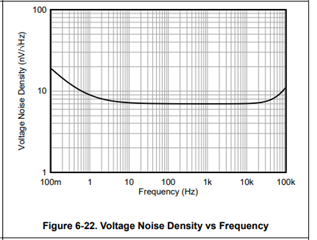
We can calculate what it should be from the spot noise plots, this is 7nV flatband with 0.7Hz 1/f corner

Getting an equivalent flat noise over the 0.1 to 10Hz span, used this equation, from this app note, I should probably have changed this article name to be for all op amps.
https://www.ti.com/lit/an/sboa066a/sboa066a.pdf

Evaluating this gives 8.05nV
Then getting the RMS noise in that 9.9Hz span, 8.05nV*sqrt(9.9) = 25.4nVrms, then using a 6X crest factor, should have been 152nVpp - so yes the plot is missing a factor of 2 adjustment is would seem, but still really low - that 1/f corner is remarkable.
I had put this kind of info into some AudioXpress articles, here is the preamp active filter one,
Low Frequency and Popcorn Noise in High Speed Amplifiers part 9 updated April20_2020.docx
And the spec lines do indeed show 200nVpp for the 0.1 to 10Hz input voltage noise. So yes, the plot has been scaled down by a factor of 2 by accident I am guessing, or maybe the y-axis in the plot just needed to be 100nV/div

Hi Chia,
I hope you are doing well today.
Hi Chia,
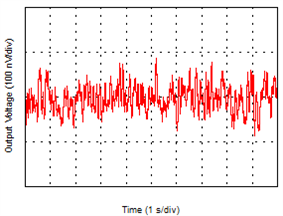
I hope you are doing well. We remeasured the data this afternoon (please see below). We also made note of it and will be updating the data sheet soon.
Thank you for bringing this to our attention. It seems like the old data may have been averaged for some reason.

Thank you,
Daniel
I normally calculate the RTI voltage noise in 3 steps.
1. Calculate the white noise (wideband) by referring to a spot noise well above 1/f corner. For the case of OPA205, taking the spot noise of 7 nV @ 1 kHz is well sufficient.
White noise = 7 nV * SQRT(10 - 0.1) = 22 nVrms
2. Calculate the flicker noise (1/f) by referring to a spot frequency well below 1/f corner, preferably at the slope of -10 dB/decade zone. For the case of OPA205, taking the spot noise of 19 nV @ 0.1 Hz is the lowest I could get from the NSD chart.
Flicker noise = 19 nV * SQRT[0.1 * ln(10/0.1)] = 12.9 nVrms
3. Calculate the total noise by root-sum-square of both white & flicker noise
Total noise = SQRT(22 nV^2 + 12.9 nV^2) = 25.5 nVrms = 153 nVpp (factor of 6)
I am questioning the figure 6-22 in OPA205 (so do OPA206 preview part), not because of the absolute peak-to-peak noise is well less than the calculated 153 nVpp, but because of the high frequency component of the noise (close to 10 Hz end, should have an oscillation of 10 cycles in 1 sec) is not visible in time domain. The new plot that shown by Daniel is much more realistic.
Thanks TI for the prompt support. Well appreciated.