This thread has been locked.

If you have a related question, please click the "Ask a related question" button in the top right corner. The newly created question will be automatically linked to this question.

OPA855DSGEVM: Discrepancy between the measured gain bandwidth of OPA855 Evaluation Board and the product manual

Part Number: OPA855DSGEVM
Other Parts Discussed in Thread: OPA855

Hi, team,

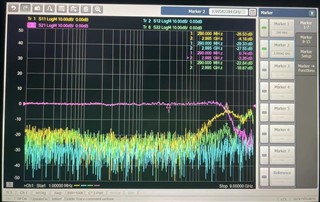
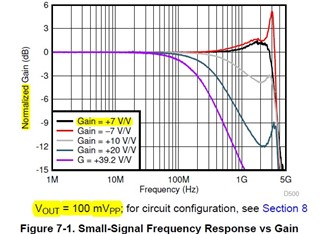
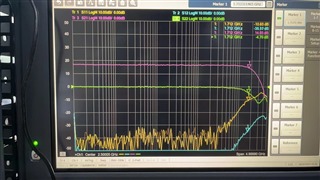
We bought an OPA855 evaluation board from TI and built a circuit network based on Page 8 of the product manual (VS+ = 2.5 V, VS– = –2.5 V, VIN+ = 0 V, RF = 453 Ω, Gain = 7 V/V, RL = 200 Ω, OPA855 Rev. C). However, we found that there was a big difference between the measured gain bandwidth curve, in constast to the black curve shown in Figure 7-1 on Page 8 of the product manual. Specifically, the bandwidth (-3 dB cutoff) we measured was about 1.71 GHz, which was much smaller than the 3 GHz shown in the manual. Also, we didnot observe a gain bump at >1GHz. The input power of this measurement was -50 dBm. Was there something wrong with our measurements or our setups? Futhermore, can we use the evaluation board to reproduce a similar results shown in the product manual? 

Looking forward to your reply.

Regards,

W. Zhang

-----------

here is an image of the measured data
  • Hi,

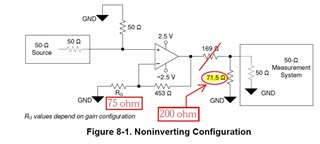
    I have a few questions/suggestions to troubleshoot this issue. Just to confirm, is the EVM configured like in Figure 8-1. This was the configuration that was used to capture the results in Figure 7-1. Rg was adjusted accordingly to get the gain of 7V/V. Can you confirm what the value of the flat portion of the trace is in your measurement. I did see a small difference in the measurement setup as the figure in the datasheet highlights a Vopp of 100mV, are you able to adjust the signal to reflect this condition. I was able to confirm that the data collected and highlighted in the figure was captured with the EVM for this device.

    Best Regards,

    Ignacio

  • hi, Ignacio,

    Thank you very much for your reply. 

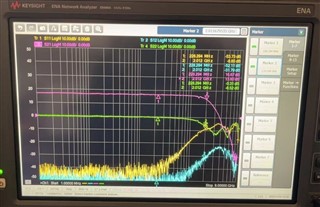
    1. According to your suggestion, we reconnected the circuit as shown in Figure 8-1. We then adjusted the Rg value to 75 ohms, and the calculated gain at this time is 7V/V. The results we measured are shown in the Figure S1 below: the display gain is ~0 dB, the bandwidth is ~3.0 GHz, and the input power is -60 dBm.


                                                                                                                       Figure S1

    But we have a doubt here, that is, the measured gain is 0 dB, not 7V/V (or ~17 dB) as stated in the manual. What is the reason for this? Moreover, we also want to confirm that Figure 7-1 in the TI product manual shows the normalized gain curve. Which frequency is it normalized to?

    2. To obtain an output gain of 7V/V (or ~17 dB), we removed the 169 ohms in Figure 8-1 and adjust the load (71.5 ohms marked by the red circle in the figure below) to RL = 200 ohms. At this time, the measured gain of the curve is ~17 dB, while the bandwidth is only 2.0 GHz and the input power is -60 dBm, as shown in Figure S2 below.


                                                                                                                             Figure S2


    Thus, we still could not fully reproduce the data shown in Figure 7-1. Is there something wrong with our measurement or understanding?

    Best regards,

    W. Zhang

  • Hi,

    The reason you are likely seeing this 0.74dB instead of the 17dB you would expect is due to the output load network as it is attenuating your signal. This is expected as the termination internal to the analyzer voltage divides the signal, so the net gain is reduced. This is why when you removed the 169Ohm resistor, you now read 17dB as there is no longer a voltage divider, however there is likely reflections as you are not matching to the 50Ohm termination internal to the analyzer causing the reduced bandwidth. The graphs you see in the datasheet are normalized, which is done to provide a better scale for all the traces highlighted.

    Best Regards,

    Ignacio

  • thank you for your explanation. This solves our confusion.

    Best regards,

    W. Zhang