Part Number: OPA2227-EP
Other Parts Discussed in Thread: OPA2227, TINA-TI
Hi,
I'm contacting you regarding my doubts about the simulation of phase margin i did to determine op amp stability and i also want to discuss about the calculation method of this phase margin. I actually have two concerns.
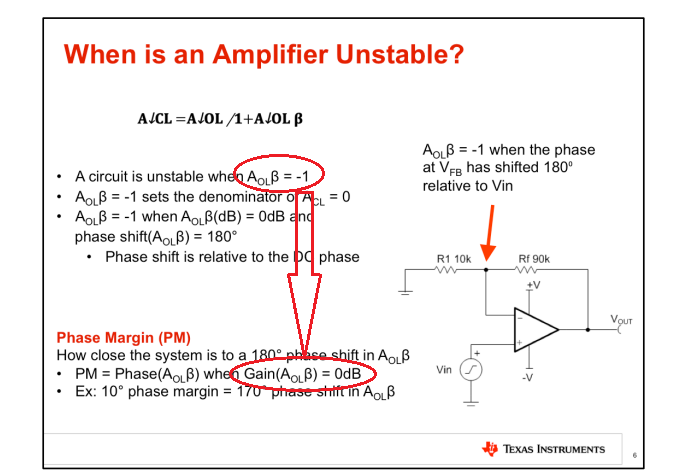
I'm using LTspice to measure the OPA2227 stability using the "big inductor/big capacitor" method given by TI the following presentation : opamps stability phase margin presentation
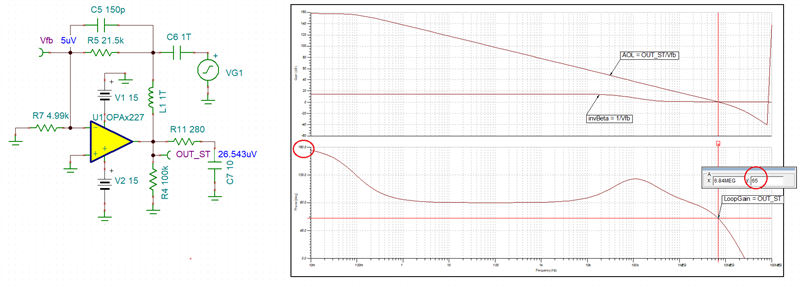
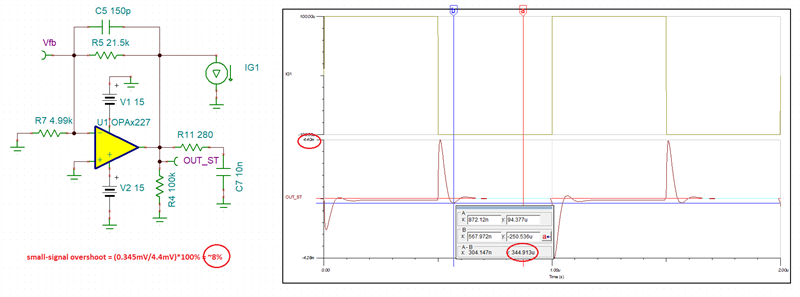
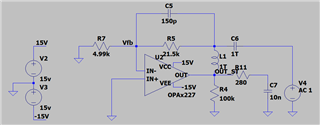
Here is the simulated circuit :
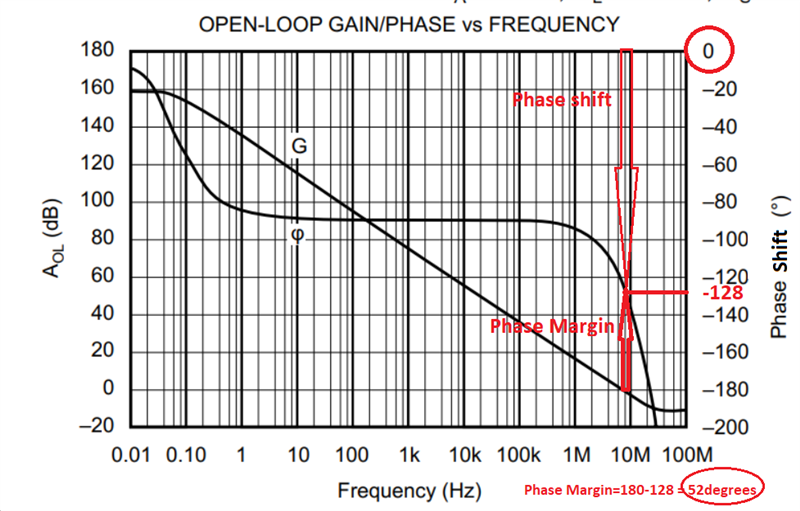
My first concern is that I followed the TI method however, the expected result of the open loop gain simulation is not exactly what is given in the datasheet. Although it's very close to the datasheet graph but, as you can see below, there is a 180 degrees shift that in the phase that was not expected :
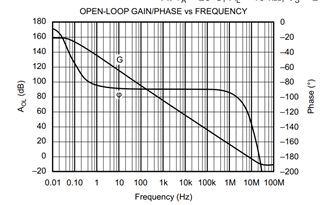
OPA2227 OPEN-LOOP GAIN/PHASE vs FREQUENCY
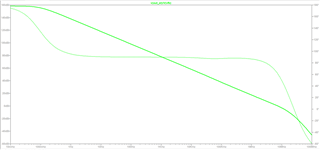
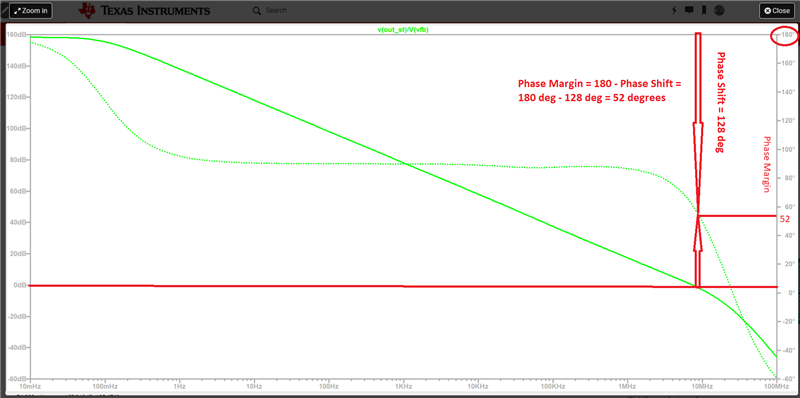
OPA2227 OPEN-LOOP GAIN/PHASE vs FREQUENCY SIMULATION
My second concern is about determining the phase margin. I see in the litterature that the phase margin represents how far the phase is shifting from -180 degrees and so, it should be equal to 180 plus phase shift (PhaseMargin = phase -(-180) ) at 0db loop gain but in the TI presentation link given above, it's said that the phase margin is equal to the phase shift at 0db loop gain. Could you please tell me where does this comes from?
Could you also help me to determine where is that 180 degrees phase shift coming from in my simulation?
Thank you in advance.