Dear TI Forum
Hope you are doing well.
2 month ago, I've asked some questions about this plot, but I'm sorry to see your answer too late.
I have more questions about this plot.
1. All conditions are same without temperature.
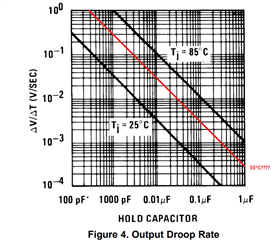
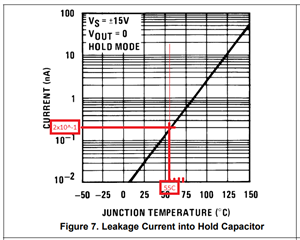
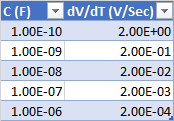
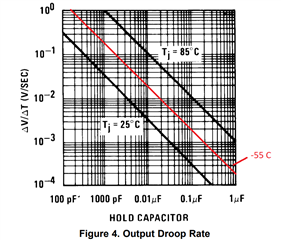
If LF-198 works in 55ºC, Droop rate plot will be drawed like below red line?
If yes, all plots of droop rate condition between 25ºC~85ºC will be placed between 25ºC~85ºC plot like 55ºC?
If you have any question, please contact me.
Thank you in advance.

Best Regards,
Wantae, Kim


