


Hi
I downloaded the TINA Spice sbam456b.
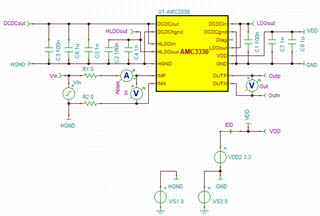
Filter 1 is what is on the EVM and what was default in the sbam456b circuit. R1=R2=10ohms C=10nf with a cutoff freq of 796kHz
| Freq | Vin | Vout | Gain | Input Filter | Error = (Ideal - measured)/Ideal - 1 |
| 1k | +/-1V | +/-2V | 2 | Filter1 | 0% |
| 50k | +/-1V | +/-1.98V | 1.98 | Filter1 | 1% |
| 100k | +/- 0.999V | +1.91/-1.92V | 1.911912 | Filter1 | 4% |
| 150k | +/- 0.980V | +1.81/-1.82V | 1.846939 | Filter1 | 8% |
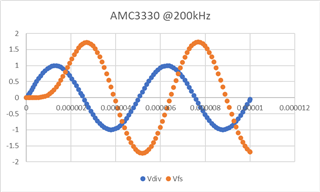
| 200k | +/- 0.999V | +/-1.73V | 1.731732 | Filter1 | 13% |
| 375k | +/- 0.9V | +/-1.05V | 1.166667 | Filter1 | 42% |
| 1k | +/-1V | +/-2V | 2 | No | 0% |
| 50k | +/- 0.998V | +/-1.98V | 1.983968 | No | 1% |
| 100k | +/- 0.999V | +/-1.93V | 1.931932 | No | 3% |
| 150k | +/- 0.999V | +/-1.85V | 1.851852 | No | 7% |
| 200k | +0.998/-0.997V | +/-1.74V | 1.745236 | No | 13% |
| 375k | +0.996/-0.997V | +/-1.16V | 1.164659 | No | 42% |
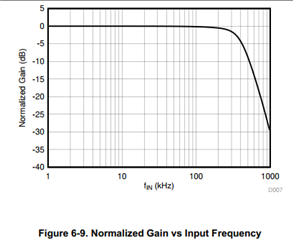
I'm not expecting any loss of amplitude @vout at 50k, 100, 150k, 200kHz. I realize the typical BW from the datasheet is 375kHz, but the output graph looks flat for the lower frequencies.
Please explain.
Thanks,
Jaynie
