This thread has been locked.

If you have a related question, please click the "Ask a related question" button in the top right corner. The newly created question will be automatically linked to this question.

OPA856: Signal to noise simulation in TINA TI

Part Number: OPA856
Other Parts Discussed in Thread: TINA-TI

Dear all,

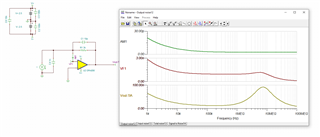
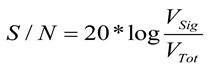
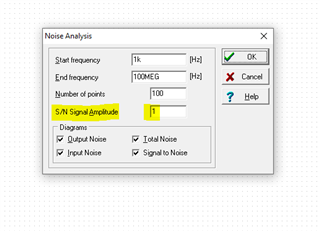
Would you please help me to plot SNR (Signal to noise ratio) in TINA TI for the following circuit? it is an transimpedance amplifier:

What procedure should I follow in the post processing feature of TINA TI? 

Transimpedance test-OPA856.TSC

Best regards,  

  • Hello Behnam,

    In TINA-TI you can simulate four noise plots that you can use the examine the noise of your circuit. This option is located under analysis --> noise analysis, or by pressing ctrl + alt + N. These four types of noise are:

    1. Input noise
    2. Output noise
    3. Total Noise
    4. SNR

    Input noise and output noise plot the spot noise or spectral density over frequency of your circuit's noise which have units in terms of V/sqrtHz. Total Noise and SNR plot the integrated output noise of your circuit over the bandwidth in terms of V or dB. SNR plot shows the integrated SNR where the SNR spectral density is calculated as: 20log(Vout/Vnoise). This is integrated over closed-loop bandwidth. You can correlate the total noise to the SNR noise by using a normalized output voltage of 1 V.

    Thank you,
    Sima 

  • Hello Sima,

    Thank you very much for useful answers.

    I have two questions regarding the noise analysis, in the same simulation for (Transimpedance test-OPA856.TSC) I see that the output noise is a constant figure as follows, is that correct? would you please why it is constant in all frequencies? 

    Regarding the SNR, it seems it is very high, is this realistic? (84.55 dB @ 3MHz), I expected something around 50 dB!

    Best Regards,

    Behnam,

  • Hello Behnam,

      The output noise looks flat because of the multiple curves stacked which make the axis scale larger. When you go to view separate curves you get these plots:

      The plots match the datasheet figure 7-5, which shows the noise is modeled for this device: 

      For SNR, Tina-TI calculates it this way:

    Where, Vsig is the expected signal amplitude, and this is default 1V from the noise analysis dialog input, and Vtot is the total noise @ frequency. 

    For your case, your Total Noise at 3MHz shows 56.11uV RMS, and if you chose "1V" for your SNR analysis, you will read 85dB in SNR as you have observed (=20*log(1V / 56.11uV)= 85dB).

    Thank you,
    Sima