This thread has been locked.

If you have a related question, please click the "Ask a related question" button in the top right corner. The newly created question will be automatically linked to this question.

OPA189: Slew Rate of OPA189, OPA2189 and TLV2888

Part Number: OPA189
Other Parts Discussed in Thread: OPA188, OPA182, TLV2888

Tool/software:

Dear Texas Support Team,

OPA189 (Rev. I) It seems that the Slew Rate in the table does not match the figure 36 at page 16.
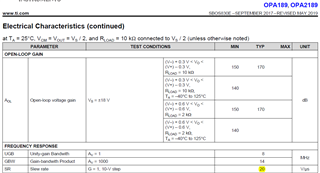
  Fig. 36

 The measured slew rate at 200kHz was significantly greater than 1V/µs. (It's fine!)

TLV2888 (Initial Release) It seems that the Slew Rate in the table does not match the figure 5-40 at page 12.

 Fig. 5-40  peak or peak-to-peak?

 is the SR defined in the figures? Is there a safety surcharge that applies to a specific THD (not Vpeak*2*pi*f for sinusoidal signal)?

(Is the SR dependent on Vs by more than a factor of 2? Is the typical SR shown in the illustrations?)

By the way: Is the dependency of Vs for TLV288 unique? It is not shown in figure 36 of OPA189.

Many thanks and best regards!

p.s.

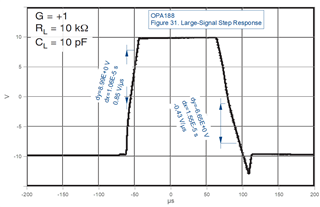
A few years ago I had problems with OPA188 (Vdd=+6V, Vss=-6V, gain=+1):

Data sheet specification is 0,8V/µs typ.

  • Ralph2,

    1. This issue has shown up several times in the past few months and we are working on a resolution.
    2. You are correct that the OPA189 slew-rate is 20 V/us, and the curve should be what is shown in green in your graph.  I checked the circuit and it closely matched the expected performance for your green curve.  Below is a summary of my measured results.  I think your graphs also verify this but they are a little hard for me to read. 
    3. Based on the slew rate of OPA189, the curve boundary is at 32Vpp (16Vpk).  However, keep in mind that 20 V/us is typical and you could expect ±20% variation in this parameter. 
      1. The curve is boundary is an indication of gross distortion (visible on oscilloscope).  All amplifiers will have some distortion and the distortion will increase as you approach the boundary. 
      2. The curve assumes an ideal slew rate.  In reality slew behavior is impacted by the amplitude of the signal.  Small signals will not activate slewing behavior.  The boundary between small signal and large signal behavior is different on different devices and this can impact the actual full power bandwidth.  Furthermore some devices have slew boost which causes slew rate to increase at higher amplitudes. 
      3. The full-power bandwidth equation assumes slew-rate is constant in independent of signal amplitude, but the actual device does have these limitations.  Thus the measured distortion may differ somewhat compared to the curve.  
    4. I will check with the engineers on the TLV2888 to understand the discrepancies on the full power bandwidth curve.  It is possible that  the curve was measured.  I also have a similar case with OPA182.  The published curve is slightly different from the theoretical curve, and the published curve is closer to actual device performance than the theoretical curve.
    5. Regarding your measurements on the OPA188.  I think that you are getting approximately what I would expect.  The first curve at approximately 25kHz 1Vpk is relatively undistorted.  At 25kHz the max peak signal is about 5V and 1V is well inside this limit.  At 120kHz 1Vpk you are directly on the curve and I would expect some distortion.
      1. Note: one issue (misunderstanding) with full-power bandwidth curve is that it is really a boundary of gross distortion.  Often people say inside the curve is undistorted and outside the curve is distorted, but that really isn't true.  I would say the curve identifies a boundary of gross distortion. 
      2. The curve for OPA188 is labeled in volts peak-to-peak but should really be in peak.
    6. I think a good general approach to using the full power bandwidth curve is to add significant margin in your design to avoid the boundary.  

    8015.opa182-opa189-full-power-bw.pdf

    Sorry for your difficulty with these plots.  I am not sure why this issue seems to have propagated to several data-sheets or why we are currently getting a lot of feedback on this issue.  We are working towards a better approach that shows a THD heat map vs amplitude and frequency.  This would be similar to the full-power bandwidth curve but would show measured THD over the map rather than a simple boundary for gross distortion.  In the meantime, I will work with our team in charge of the data sheets to update these curves but that may take time.  In the mean time you can use the Excel file below to generate the curves automatically.   

    opa189.xlsx

    Best regards, Art

  • Art,

    Thank you very much for testing and the helpful answer.

    ad 3.)
    I am aware that slew rate is only a typical value which is dependent on the production tolerance, temperature, signal polarity, power supply voltage and much more. I have therefore always used SR with a safety factor of 1.5 (rule of thumb: SRmin = 2/3*SRtyp.).

    Sometimes you can find data scheets with square wave test signal, but then the input stage is usually overdriven. Therefore, I usually only consider sinusoidal signals.

    ad 5.a)
    OPA188: It would be nice if the note "G = -1" appeared in Figure 36. "Maximum Output Voltage vs Frequency/Maximum output voltage without slew-rate induced distortion."

      (use zoom by mouse click on picture)
    In column "CONDITIONS" in Table at Page 5 at slew rate should be "G = -1" - not "G = +1"


    A THD heat map vs amplitude and frequency is a great idea, but very time-consuming to test.

    With this answer and the attached Excel file, I can use OPA189 without doubt.
    I will wait for the final TD for TLV2888.

    Many thanks and best regards! Ralph