This thread has been locked.

If you have a related question, please click the "Ask a related question" button in the top right corner. The newly created question will be automatically linked to this question.

TLV6001: Signal Chain Issue with Phase Decay - Seeking Assistance

Part Number: TLV6001
Other Parts Discussed in Thread: OPA357

Tool/software:

Hello,

I am encountering an issue with my signal chain design and would appreciate some insights from TI engineers.

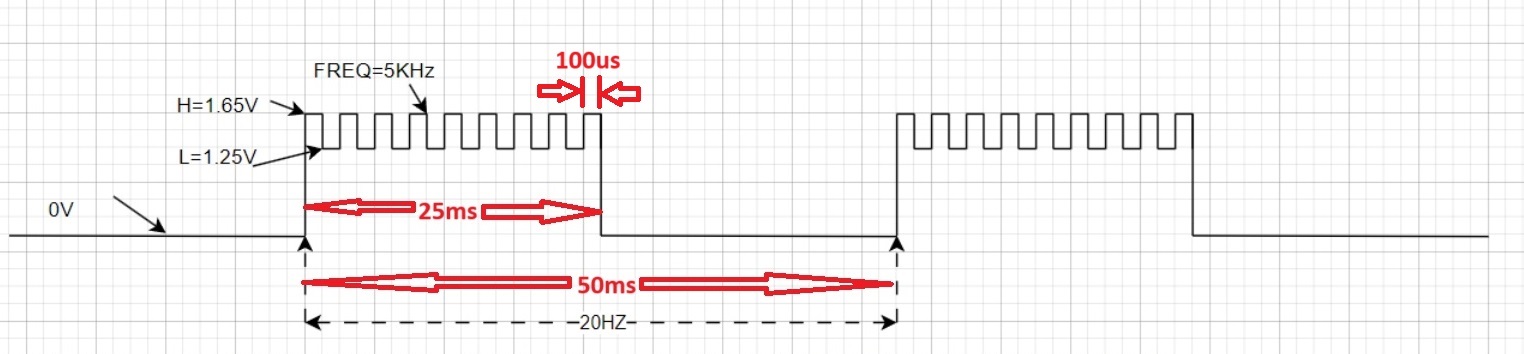
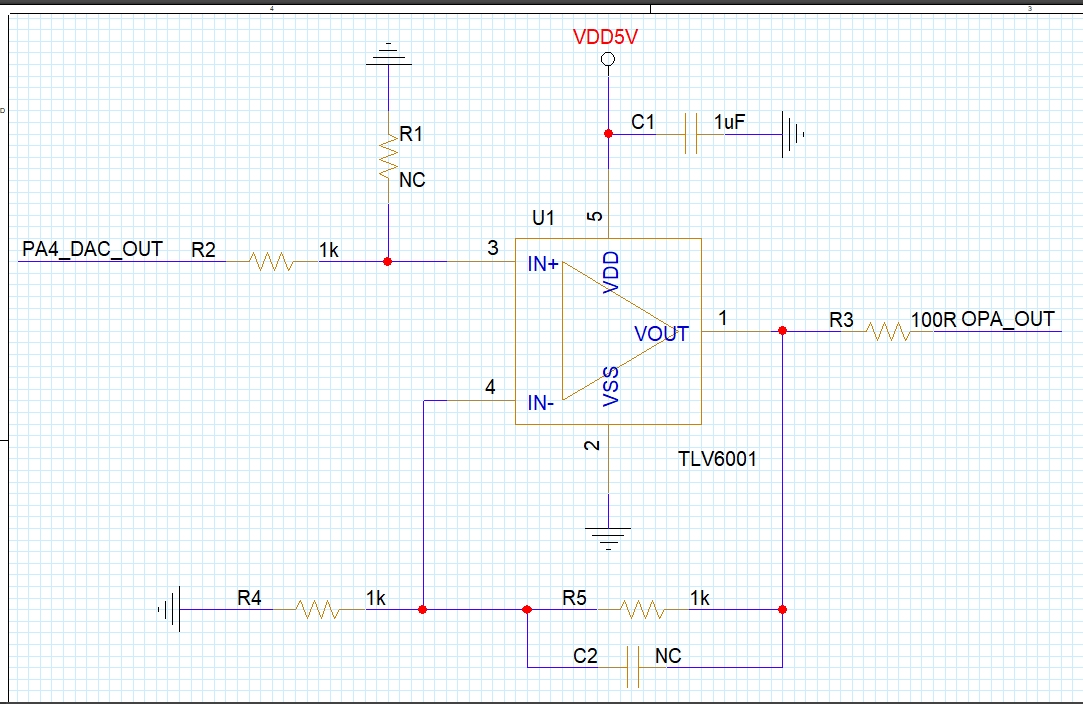
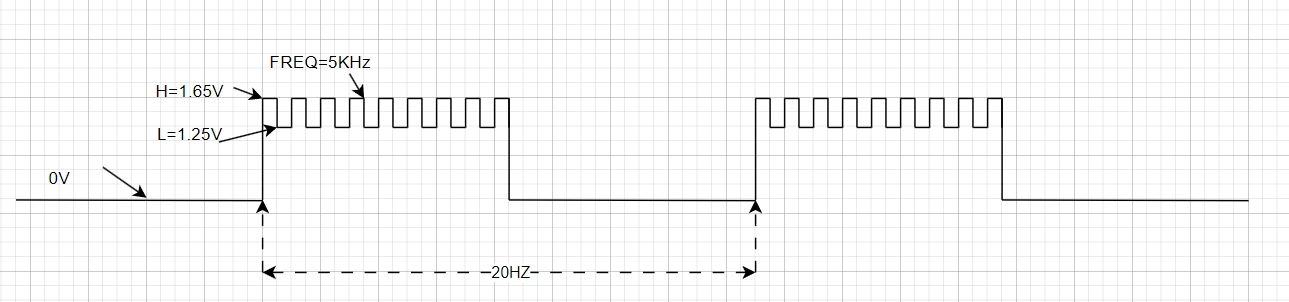
In my system, I am using an MCU with a DAC (STM32F072x8) that outputs a 20Hz square wave, ranging from 0V to 1.65V (i.e., 50ms high level and 50ms low level). On the high level of this square wave, I superimpose a 5kHz square wave with an amplitude range of 1.25V to 1.65V. There are 64 cycles of the 5kHz square wave during each high level.

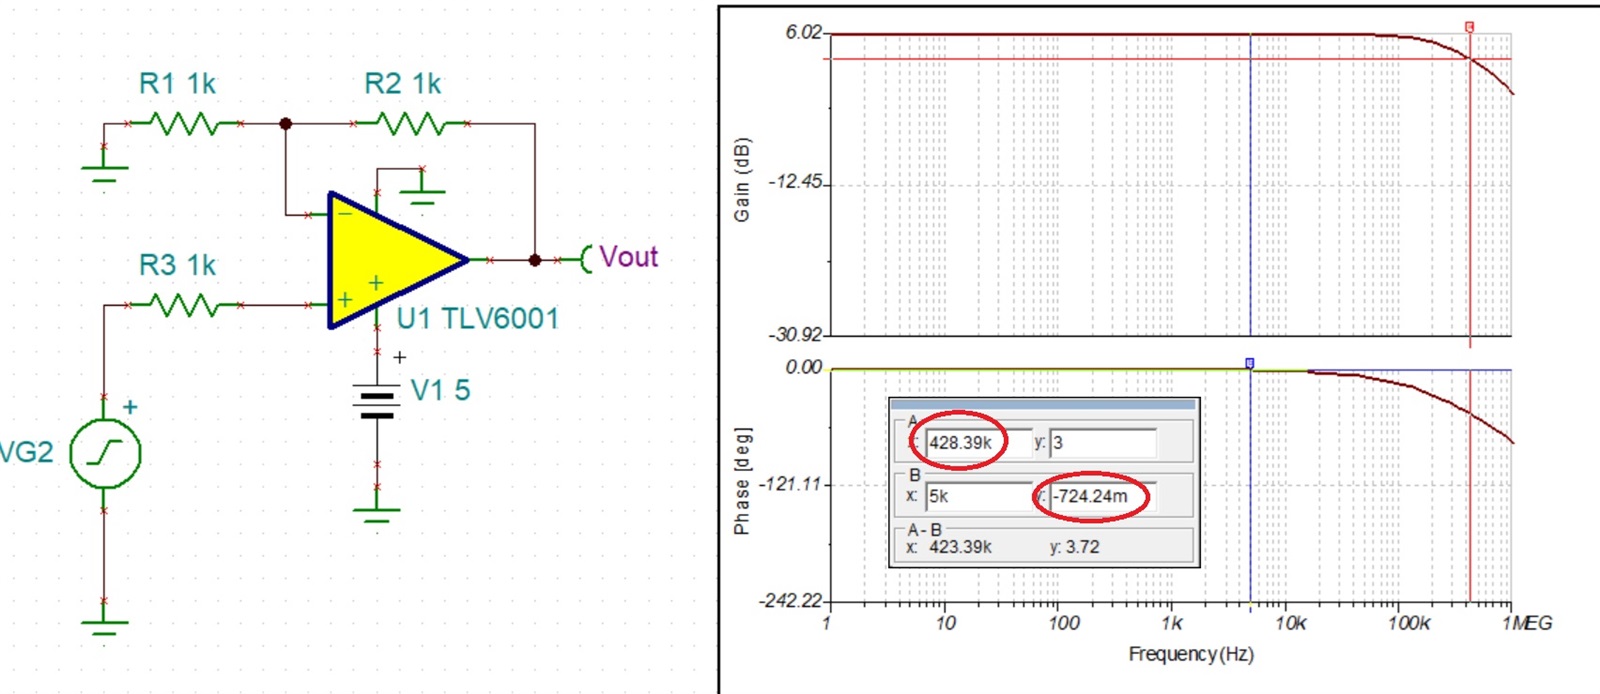
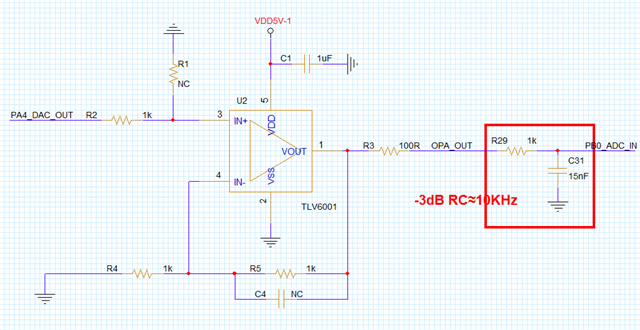
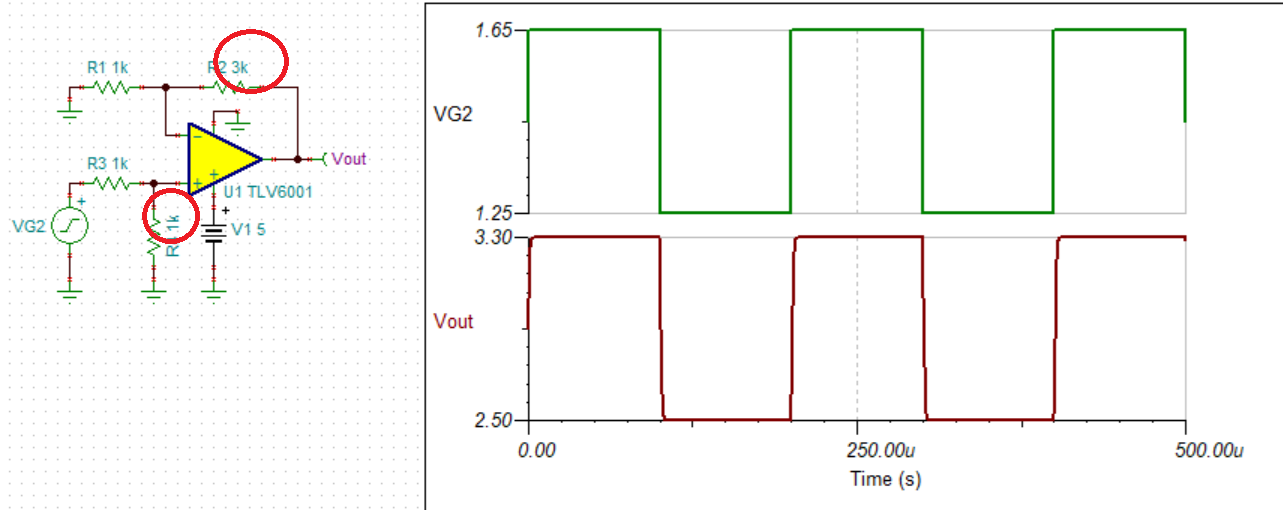
The signal passes through a closed-loop non-inverting amplifier with a gain of 2, using a TLV6001 op-amp (with a GBW of 1MHz). The amplified signal is then fed back into the MCU's ADC for phase measurement. The measurement takes place during the high level when the 5kHz square wave is present, and FFT is used to compute the phase.

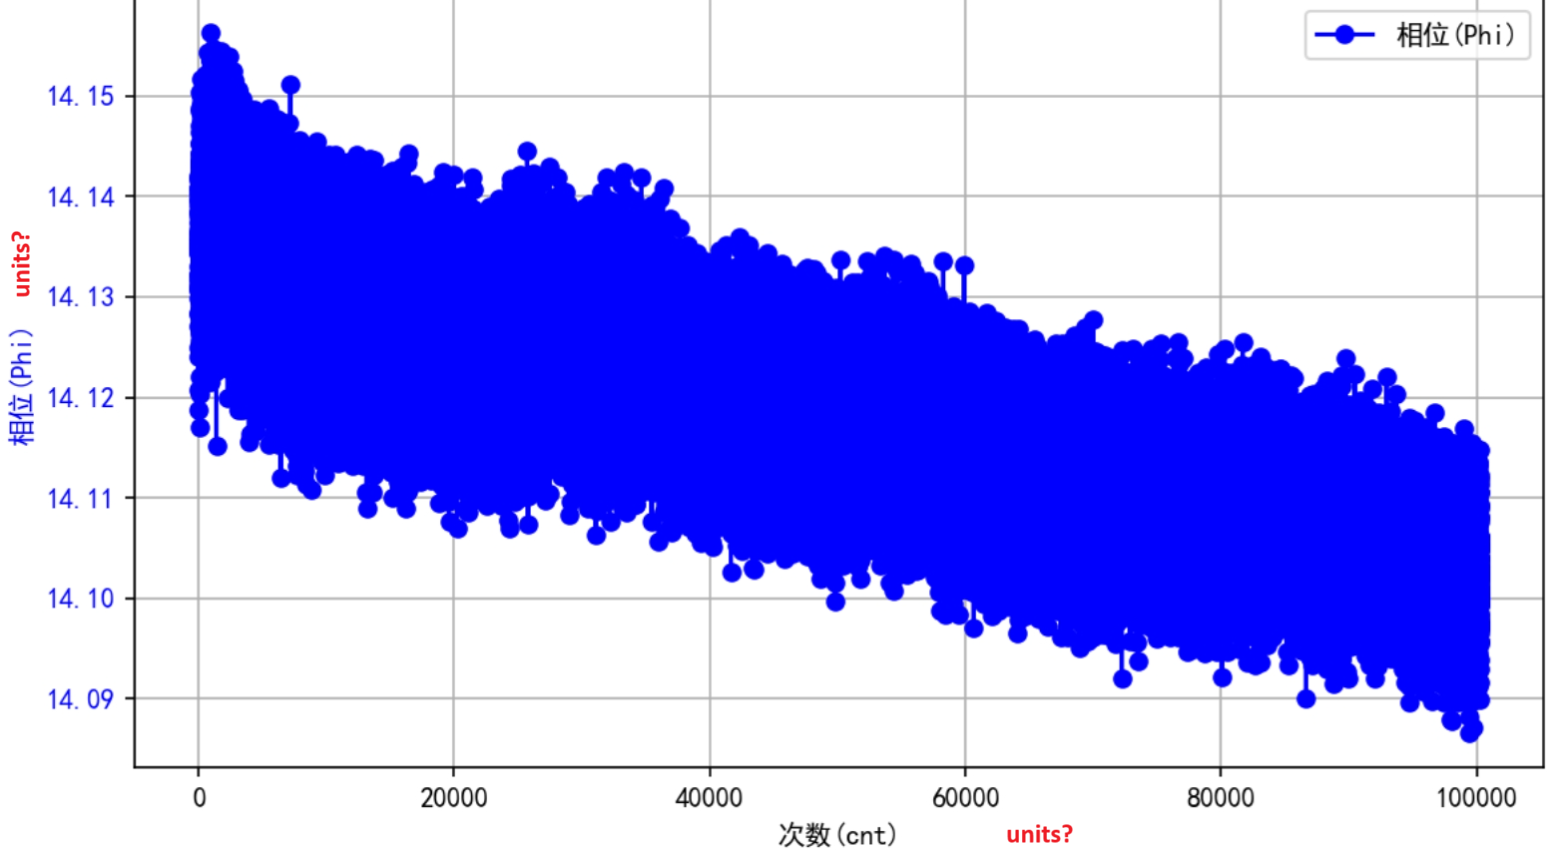
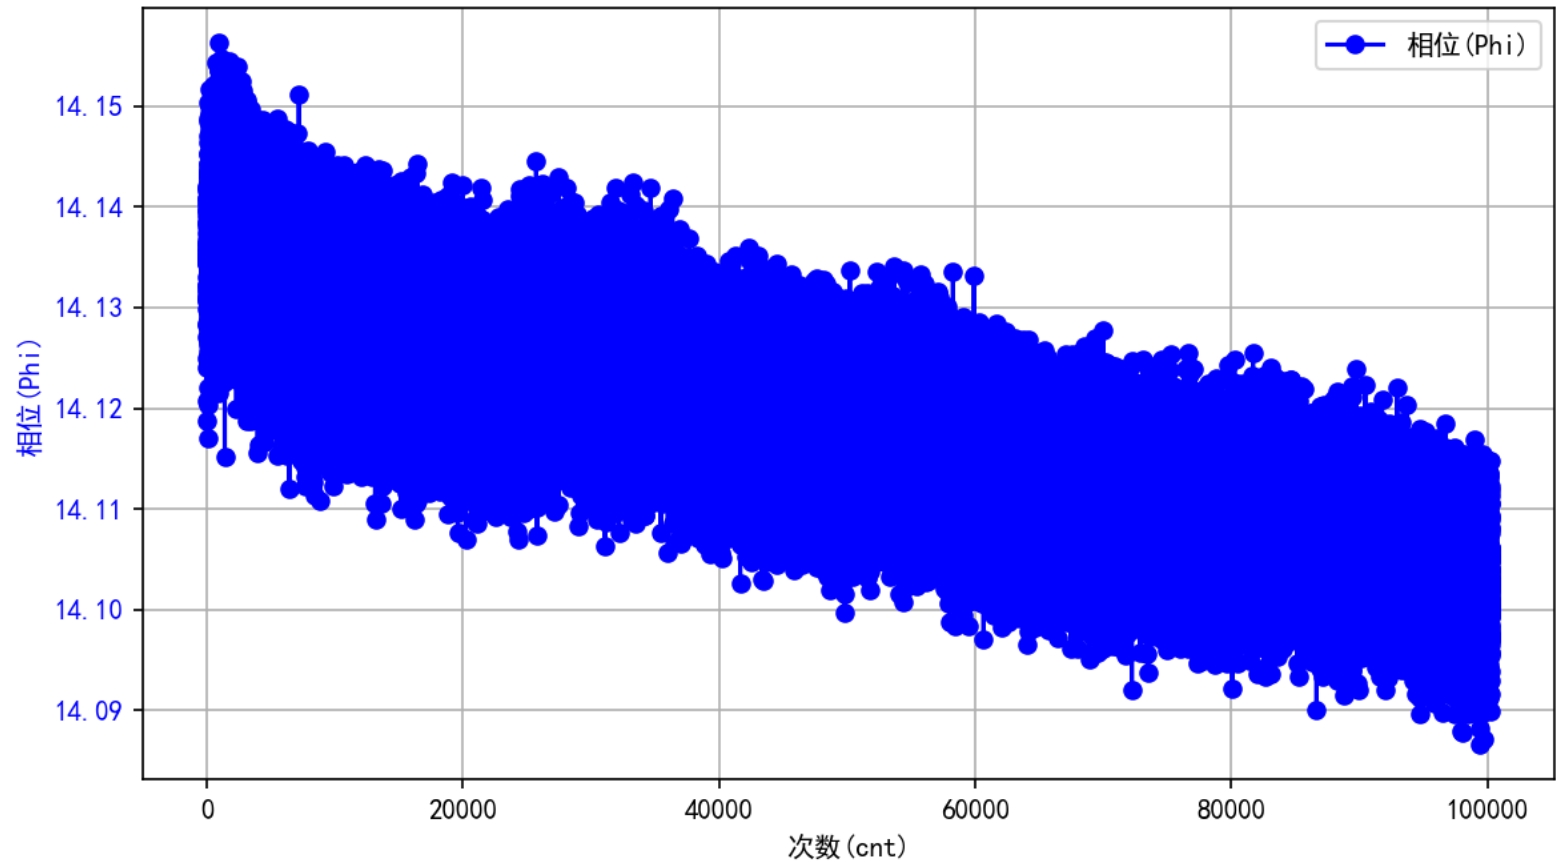
The issue I am facing is that as the number of measurements increases, I observe that the phase of the system gradually decreases—approximately 0.1° per 100W measurements. This is an unacceptable phenomenon in my current system.

To address this issue, I have tried the following approaches:

  1. Replacing the TLV6001 op-amp with an OPA357 (250MHz) and enabling the EN pin.

  2. Disabling the op-amp after each high-level measurement and re-enabling it before the next measurement.

  3. I also tested the system by removing the op-amp and directly connecting the MCU DAC output to the ADC input. Under the same environmental conditions and measurement setup, the phase remained stable, with no decay after multiple measurements.

  4. The entire test environment was kept at a constant room temperature, with no temperature fluctuations during the tests.

I would like to understand the root cause of the phase decay. What could be causing this issue, and how can I resolve it? Additionally, if I were to simulate this in TINA, how should I set up the simulation to accurately replicate this behavior?

I would greatly appreciate any guidance from TI engineers.

Thank you!

  • Please label both axis of the graph below so I can understand how much phase shift per unit time (not count) you measure - see below.

    Please note that -3dB bandwidth of your circuit configuration is about 428kHz and therefore at 5kHz input signal the output phase shift will be about -0.7degree - see below.

    Of course, OPA357 with GBW 250 time higher than TLV6001 (250MHz vs 1MHz, respectively) will have much lower phase shift at 5kHz than TLV6001.

    TLV6002 Phase Shift.TSC

  • Thank you for your response. Below are the detailed steps of the software processing:

    1. A measurement is taken every 50ms. A timer simultaneously triggers both the DAC output and ADC sampling, with a sampling rate of 320kHz.

    2. Each measurement consists of 64 cycles of a 5kHz square wave (high level: 1650mV, low level: 1250mV). The first 16 and last 16 cycles are discarded. A DFT is then performed on the middle 32 cycles to calculate the phase of the 5kHz fundamental component.

    3. When not measuring, the DAC outputs 0V.

    Y-axis explanation:
    In simple terms, it represents a constant set value, which reflects the phase currently measured by the system (DAC → OPA → ADC) using FFT.
    When the system only includes DAC → ADC, this Y-axis value remains stable over time.

    X-axis explanation:
    The X-axis represents the number of measurements. Based on current testing, it has been observed that as the number of measurements increases (i.e., over time), the measured phase value of the entire system continues to decay, rather than remaining stable.

  • Y-axis explanation:
    In simple terms, it represents a constant set value, which reflects the phase currently measured by the system (DAC → OPA → ADC) using FFT.
    When the system only includes DAC → ADC, this Y-axis value remains stable over time.

    Does it mean it's ~14 degrees phase shift between input and output and dropping?

    X-axis explanation:
    The X-axis represents the number of measurements. Based on current testing, it has been observed that as the number of measurements increases (i.e., over time), the measured phase value of the entire system continues to decay, rather than remaining stable.

    So each measurement is taken every 12.8ms? 64*(1/5,000)

    You do not show the details like filter in front of ADC - I suspect that the issue may be that at the sampling rate of 320kHz the output does not settle resulting in continuing phase shift.

  • Does it mean it's ~14 degrees phase shift between input and output and dropping?

    Yes, you understood correctly. This 14 degrees phase shift is a fixed phase in my current system (DAC -> OPA -> RC-ADC), and as the number of measurements increases (time increases), the phase gradually decreases.

    So each measurement is taken every 12.8ms? 64(1/5,000)*

    Yes, the measurement time is fixed.

    Yes, the circuit I previously provided was missing the RC filter section. Please refer to the new schematic where I've added the pre-filter section before the ADC. Currently, the actual application only uses a simple RC filter with a cutoff frequency of around 10kHz.

    I'd like to add a few more things:

    1. You might wonder why it's exactly 14. This is actually a constant value minus the system's phase, and the constant is fixed and unchanging.

    2. In the current system, if you remove the OPA, i.e., DAC -> RC -> ADC, the entire system's phase becomes very stable.

    I hope the above content clarifies my current circuit.

  • The corner frequency of the output filter is fc = 1/(6.28*1100*15e-9) = 9.65kHz, which translates into a period of 103us.  In the meantime each pulse lasts for 100us (see below). This means that the most likely cause of the continuous phase shift you see has to do with the fact that the output is not settled when the measurement is taken. 

    Also, in order to apply a clean square input waveform it may be a good idea to terminate the input with 1k resistor and then increase the gain to 4 to compensate for halving the input - see below.