This thread has been locked.

If you have a related question, please click the "Ask a related question" button in the top right corner. The newly created question will be automatically linked to this question.

OPA2392: Aol model

Part Number: OPA2392
Other Parts Discussed in Thread: TLV9004

Tool/software:

Hi Team,

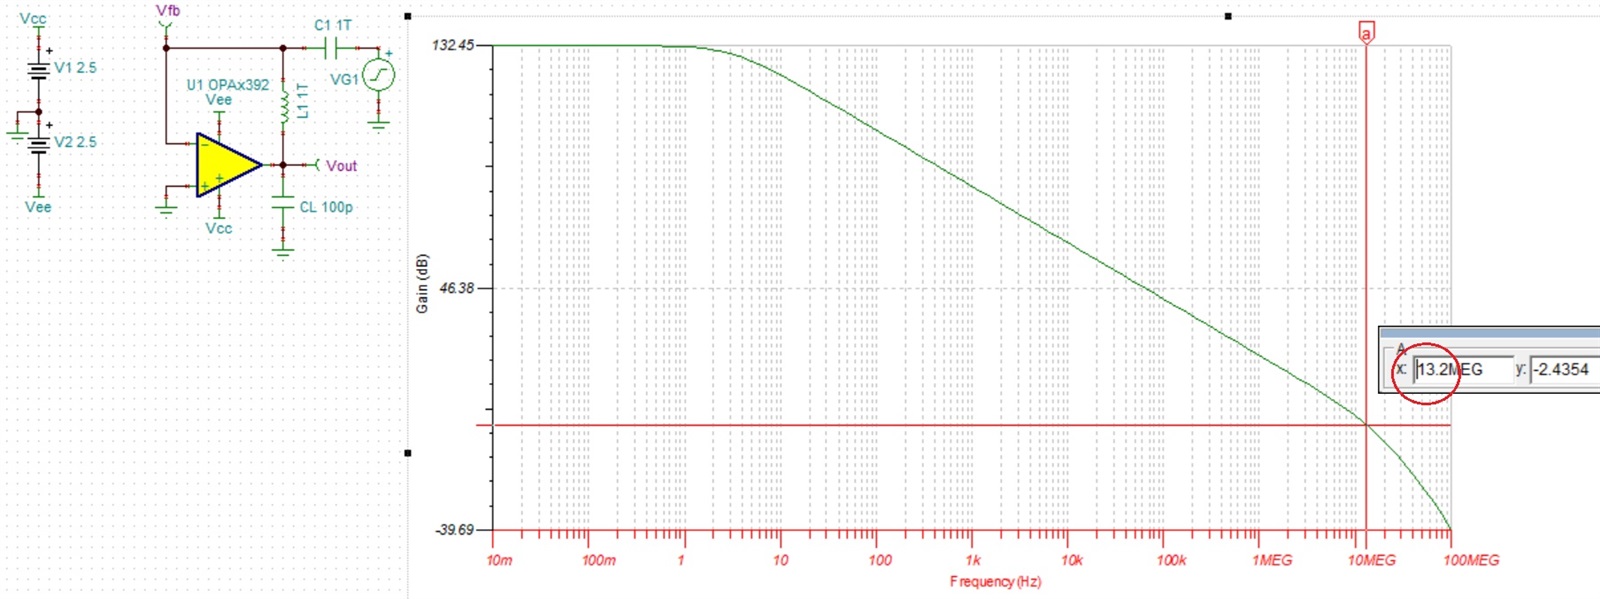
I am trying to simulate Aol spec of OPA2392 in Tina, the phase margin at Gain = 0dB is 80.67 degrees. 

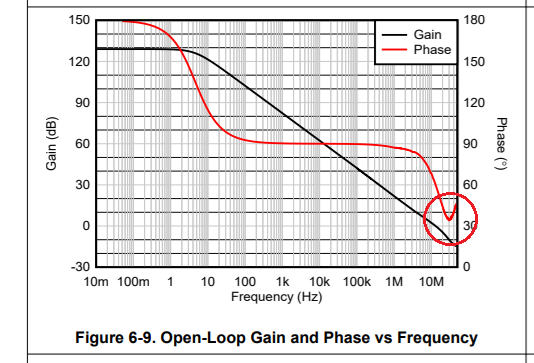
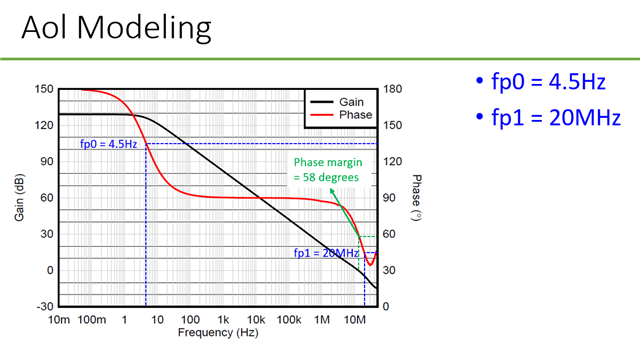
While in the datasheet, we can see the Phase margin = 58 degrees at Gain = 0dB. could you check why the TINA model has a big difference than what shown in the Datasheet? I also checked TLV9004 and the TINA results align with the datasheet graph. 
thanks a lot.

Best regards,

Yang

  • Yang,

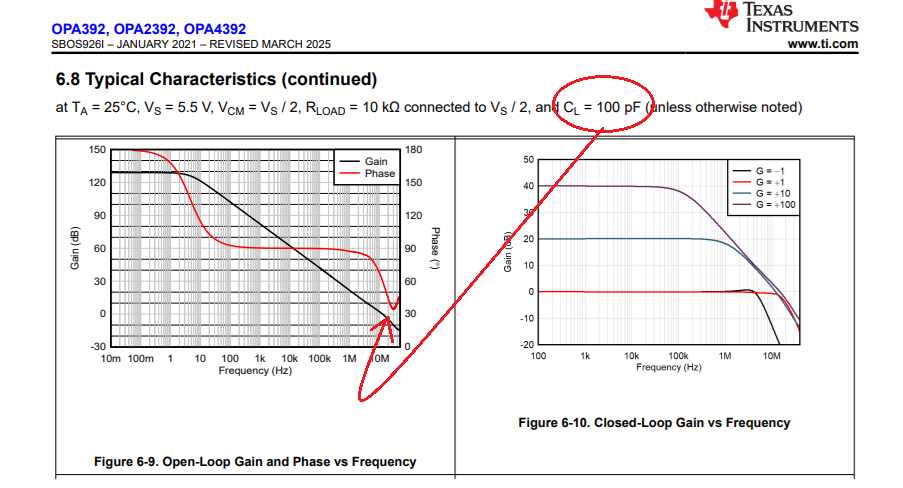
    The reason for the discrepancy you see is the fact that the OPA2392 datasheet show typical graph of AOL & Phase vs frequency with CL of 100pF, which results in the second pole, while you simulate it with no cap load - see below.

    Simulating the circuit with 100pF load, shows around 45 degrees phase margin - see below.

    OPA2392 buffer CL=100pF AC stability.TSC

  • Hi Marek,

    thanks a lot to remind the 100pF Cap. So, even with the 100pF load, there still has large difference between the simulation result and datasheet. 45 degrees V.S. 58 degrees. Does it mean the tina model is not very accurate? I suppose the tina model is developed based on 2nd-order system.

    Best regards,

    Yang

  • I believe the discrepancy lies in the drawing of the gain/phase, which shows a second pole at 20MHz instead of 13.3MHz (fp2=1/(6.28*120*100e-12).

    While the macro-model correctly places the second pole where it should be, keep in mind that the macro-model is not limited to a second-order system and it shows what actual part does including multiple high frequency parasitic poles beyond the 100MHz frequency shown below.