TLV9152-Q1: question for the V_OV over the different power supply

Part Number: TLV9152-Q1

Tool/software:

Dear team,

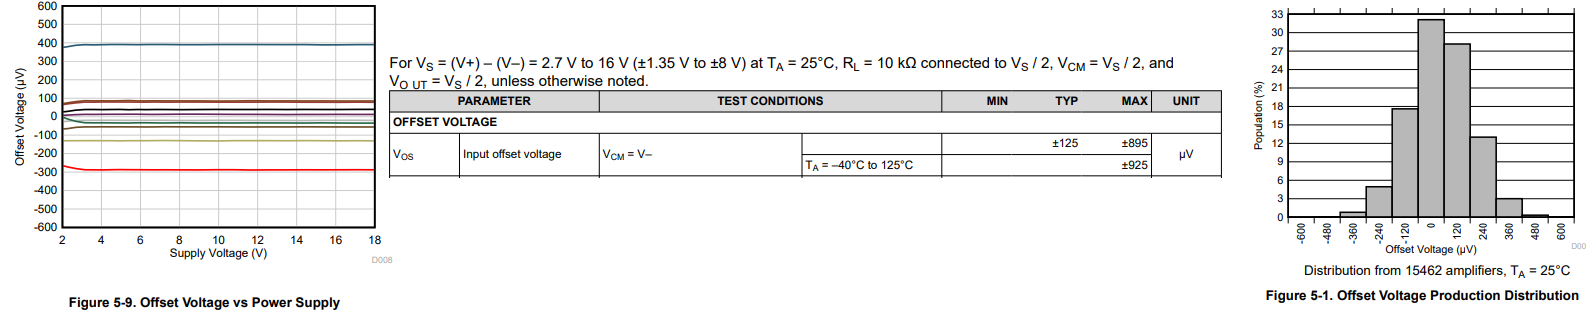
when I'm checking the curve figure of the V_OV vs V_supply.

there are different color curves on the graph but without the label to explain what these color lines stand for.

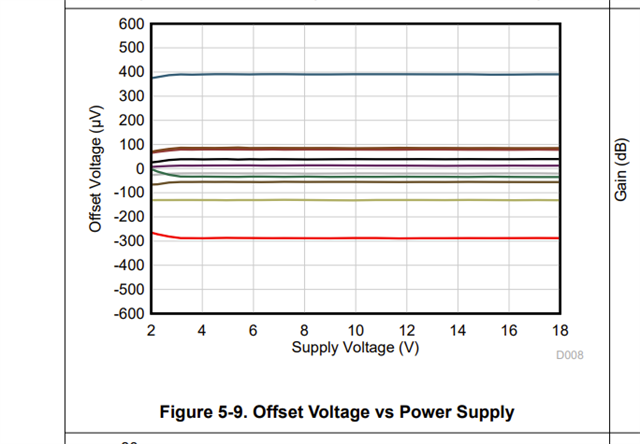
could you please explain? sincerely thanks!!!

Best regards,

Hank Lin

  • Hi Hank, 

    there are different color curves on the graph but without the label to explain what these color lines stand for.

    The input offset voltage (Viso) reported in the datasheet is not a fixed figure but can vary with supply voltage and temperature. In the captured image below, the Vios (input referred Vos) is measured at 25C, and Vios spread is shown from +-125uV to +/-895uV. Figure 5-8 is shown the Vios spread graphically in this part. Another way to view the spread is from the figure 5-1, Vios distribution in product lot at 25C. 

    If you have other questions, please let us know. 

    Best,

    Raymond