This thread has been locked.

If you have a related question, please click the "Ask a related question" button in the top right corner. The newly created question will be automatically linked to this question.

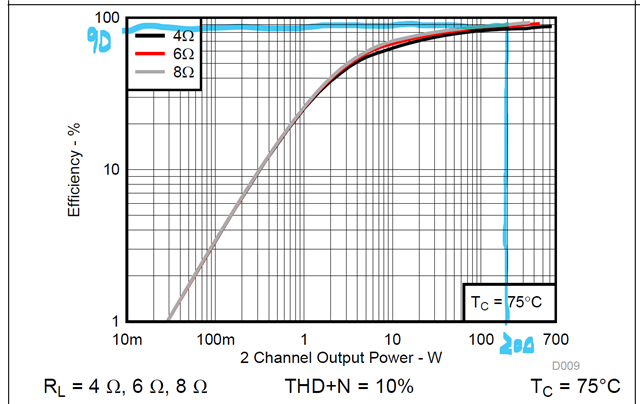
TPA3255: How to interpret Machine Efficiency vs. Output Power

Part Number: TPA3255

Hello

I have two questions regarding the efficiency graph for TPA3255.

1. I would like to see a graph of THD + N = 1%(BTL).
    If this graph is not available, how can it be expected to change ?
    I would like to get a general image.

2. I'm considering a 100W x 2ch load in BTL configuration for a single TPA3255.
    In this case, I don't understand which part of the graph I should refer to.
    Should I refer to the 100W or 200W graph ?

    Please give me some advice.

Shima(Japan)

image.png

  • Our expert will feedback you next working day.

  • Thank you for your reply. 
    I understood.

  • Hi, 

    Regarding your question1,

    The official datasheet typically provides the efficiency curve at THD+N = 10% (which is Figure 9 you provided). However, the efficiency characteristics at THD+N = 1% can be accurately inferred as follows:
    • Overall Trend: When THD+N decreases from 10% to 1%, the shape of the efficiency curve remains almost identical, and the efficiency will only decrease slightly by 1-2% at the same output power.
    • Principle Explanation: The efficiency of a Class D amplifier is mainly determined by switching losses and conduction losses. The reduction in THD+N is achieved by correcting distortion through the feedback loop, which does not significantly change the operating state of the power stage.
    • Maximum Power Difference: The only noticeable difference lies in the maximum output power. For example:
      • BTL stereo configuration, 4Ω load: Total output power is 315W (157.5W per channel) at THD+N = 10%, and 260W (130W per channel) at THD+N = 1%.
      • In all power ranges below 260W, the two efficiency curves almost coincide.
  • Thank you for your reply.

    Regarding question 1, the issue has been resolved.
    (Even at 1%, the graph doesn't change significantly from the 10% graph.)

    Regarding question 2, I haven't been able to resolve it.
    If it's 100W x 2ch, should I refer to 200W ?
    In other words, total power is applicable.

  • Hi,

    Yes, you are correct. You should reference the 200W position on the x-axis for the following reasons:

    1. Definition of the x-axis in Figure 9: The label "2 Channel Output Power - W" clearly indicates that it represents the total output power of both channels.
    2. Correspondence to Your Configuration: "100W × 2ch BTL" means that 2 independent BTL channels are operating simultaneously, with each channel delivering 100W. Therefore, the total output power is 100W × 2 = 200W.
    3. Mode Confirmation: The TPA3255 integrates 4 half-bridges internally, which can exactly form 2 independent BTL channels (stereo BTL mode). This is one of the standard operating modes of this chip.
    Additional Note: If you are using a mono BTL configuration (only 1 channel delivering 100W), you should reference the 100W position on the x-axis.
  • Thank you for the explanation.
    My question has been answered.