This thread has been locked.

If you have a related question, please click the "Ask a related question" button in the top right corner. The newly created question will be automatically linked to this question.

OPA320 Stability simulation / modified Aol curve for capacitive load


Hello,

I have posted this as well as in Webench Design Center, I am not sure if it better fits there or here. I apologize in advance if doing it wrong posting it here too. 

EDIT: Just got a reply from Webench Center.They helped me with TINA simulation but not with the methodology. So I am keeping the thread! ;)

http://e2e.ti.com/support/development_tools/webench_design_center/f/234/t/296289.aspx

New to TINA, I need help on a basic issue.

I intend to use OPA320 to drive ADC SM73201.

Traditional RC filter just after OPA and before ADC calculation suggested 33 ohms for Rflt and 1nF for Cflt.

I would like to check on OPA320 stability under this load before bench, and based on:

http://www.en-genius.net/includes/files/acqt_052906.pdf    , pg 23.

that is part of very nice Tim Green's material Operational Amplifier Stability Series, I have in mind using modified OPA320 modified Aol curve to check stability looking at gain @ freq. closed loop and phase margin.

I came up with the following circuit:

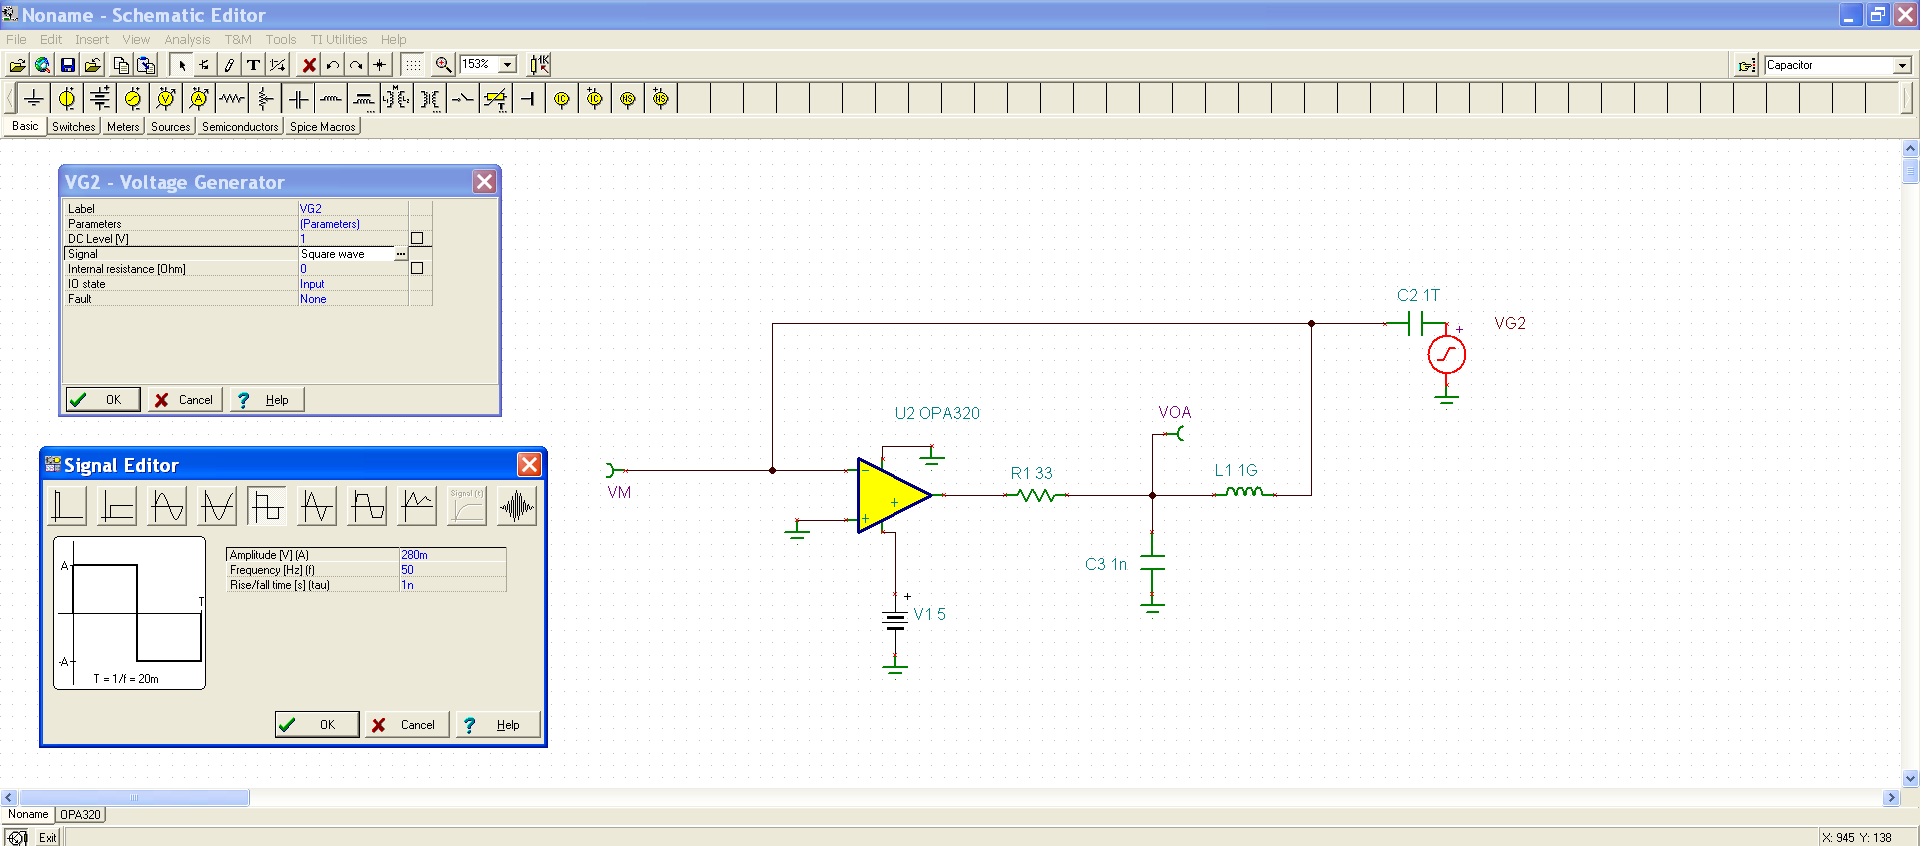
According to the cited material Aol is VOA / VM. I couldn't find, however, a way to divide them. I found the "Add Sub Mult Div" block in Help -> Analog Control, but didn't find where it is in TINA. Not available in this version?

Using this method, what are ideal (traditional?) waveform and parameters for small signal input? Square wave, 280 mv, 1 VDC, 50 Hz ?

Anyway, how to get to modified Aol curve?

What other proved methods (besides implementing it physically!) for checking on op amp adc driver stability are there?

Thank you!

  • Thiago,

    The curves can be divided in the post-processor function in the simulation screen. Run an AC transfer characteristic with your two probes. In the simulation window, click on the post processor button (has a plus sign with 3 curves below it, or go to edit -> post processor). 

    In that window, click the more button, this will allow you to divide the VOA curve by the VM curve. 

    After you have typed in the desired equation in the "Line Edit" box, give the curve an appropriate name and click create, then close the post processor. 

  • One additional comment, your simulation circuit will not give accurate results because the input common mode range is at ground. Place a 2.5V source at the non-inverting input in order to bias the op amp into the proper operating condition. 

  • John,

    Thank you for the reply!

    I have also seen in other threads which I couldn't locate right now that a transient analysis with small signal input shows that the circuit (op amp) is stable if overshoot < 40%.

    My simulation suggests that. R2 = 200 ohms and C1 = 10p represent ADC S/H impedance.

     sim

    Are those assumptions correct? Can you suggest background material on that, explaining and confirming it?

    Thank you!

  • Thiago,

    The amount of overshoot in the small signal step response is a function of the phase margin of the system. For a second order system (we can consider this op amp circuit a second order system), the relationship between overshoot and phase margin is shown below. 

    40% overshoot, corresponds to a phase margin of a little bit less than 30 degrees. While technically this is stable, it may not be optimal for driving an ADC because the value at the ADC's input will take longer to settle. The transient analysis you show above shows much less than 40% overshoot.