Part Number: INA188
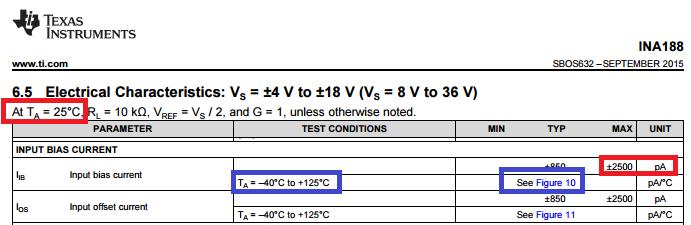
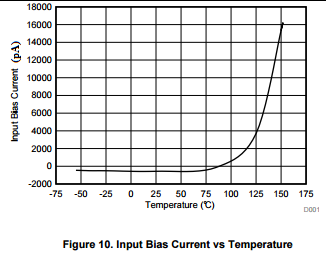
The INA188 data sheet (September, 2015) specifies maximum input bias current of 2.5 nA in Table 6.5. But Figure 10 (below) shows a much larger magnitude. Is this a typo in the figure axis?

Part Number: INA188
The INA188 data sheet (September, 2015) specifies maximum input bias current of 2.5 nA in Table 6.5. But Figure 10 (below) shows a much larger magnitude. Is this a typo in the figure axis?