This thread has been locked.

If you have a related question, please click the "Ask a related question" button in the top right corner. The newly created question will be automatically linked to this question.

OPA846: Input bias current over temperature

Part Number: OPA846

Background:

I am using an OPA846 in a transimpedance amplifier with ~100 kOhm of gain. There is a resistor equal to the gain resistor connected to the non-inverting input to cancel the DC offset caused by the input bias current. This lowers the common mode input voltage significantly.

Question:

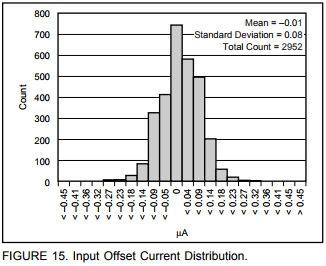
The datasheet states 10uA as the typical input bias current and 21uA as the maximum over temperature. Are there graphs of the distribution of the input bias current over temperature? I am looking for something similar to FIGURE 15 in the datasheet but for input bias current over the operating temperature range.

Thanks

  • Unfortunately we do not have the exact type of graph that you are referring to. Figure 15 graph is room temperature Ib.

    However, with the information in the datasheet we can draw some conclusions if you are interested in how far the distribution will stretch. This should only be used as guide. The system / circuit should be designed with the worst case (max) numbers specified in the datasheet.

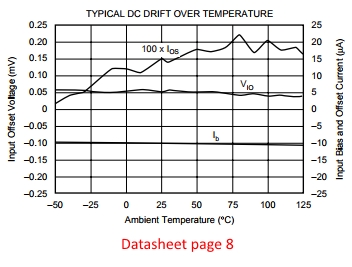
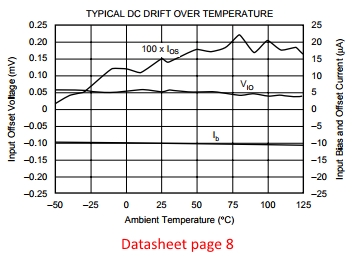
    Below attached is the info that will help infer. Fig 15 distribution ends at ~0.32uA and -40C to 85C max drift is 35nA/C. Ib drift is linear for most part based on DC drift curve.

    Hence, at 85C, the distribution can stretch out as far as ~2.42uA (= 0.32uA + 35nA/C x [85-25]).

    Hope this helps. Thanks.

  • Thanks for your response.

    Figure 15 is not a graph of input bias current (Ib), but rather input offset current (Ios).

    You used the Ib temperature drift (35nA/C) with the room temperature Ios (0.32uA) to calculate max Ios over temperature. The Ios temperature drift is different (3.5nA/C rather than 35nA/C), and I'm not interested in Ios.

    It sounds like there is not data for input bias current over temperature. This is surprising, because something had to be measured to write the datasheet specs for input bias current. Maybe it is just difficult to find.

    I have just reduced my feedback resistance to accommodate the max Ib spec.

    Thanks

  • You are correct, David. My apologies. It was an oversight on my part; Figure 15 is indeed Ios and not Ib.

    The closest data I can find for Ib over temperature is the plot below.

    The plot and the specifications are generated from measured data. Since this device was released in 2002, I am not sure of all the data archiving practices at the time but I scoured through the archives and could not find the data used in the plots.

    Thanks.