


Part Number: INA225
Hi team,
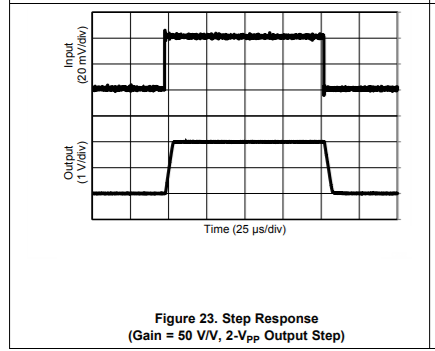
Do you have any zooming waveform to show the step response like below one? The time scale < 5us per div will be better.
Thank you.
Regards,
Allen
Part Number: INA225
Hi team,
Do you have any zooming waveform to show the step response like below one? The time scale < 5us per div will be better.
Thank you.
Regards,
Allen

