

Hi All,
In http://www.unisonic.com.tw/datasheet/S8050.pdf, the first page gives hfe values as in the tables below, but they are very much different from the graph in the second page:
| table | graph | |
| hfe1 | 100 | 200 |
| hfe2 | 120-400 | (100,200) |
| hfe3 | 40 | >100 |
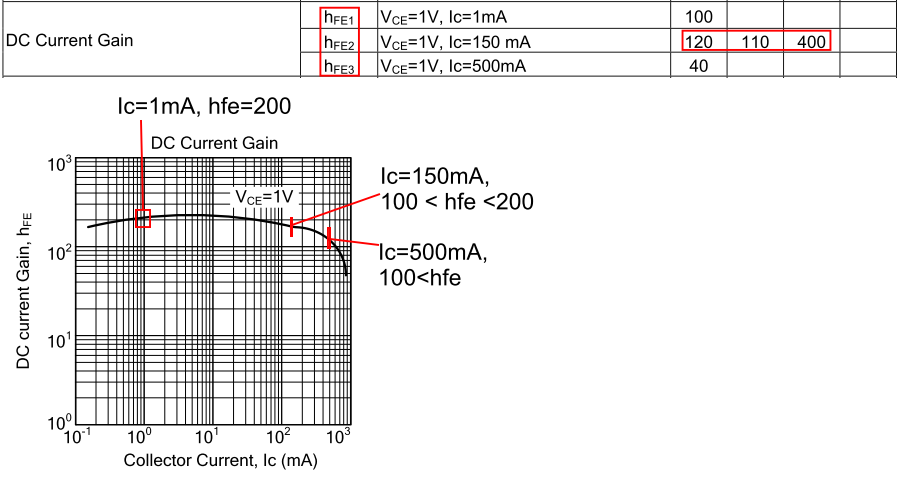
What is the reason for this difference? Which one (table or graph) should I refer to?
Zheng

