This thread has been locked.

If you have a related question, please click the "Ask a related question" button in the top right corner. The newly created question will be automatically linked to this question.

OPA196: OPA196

Part Number: OPA196

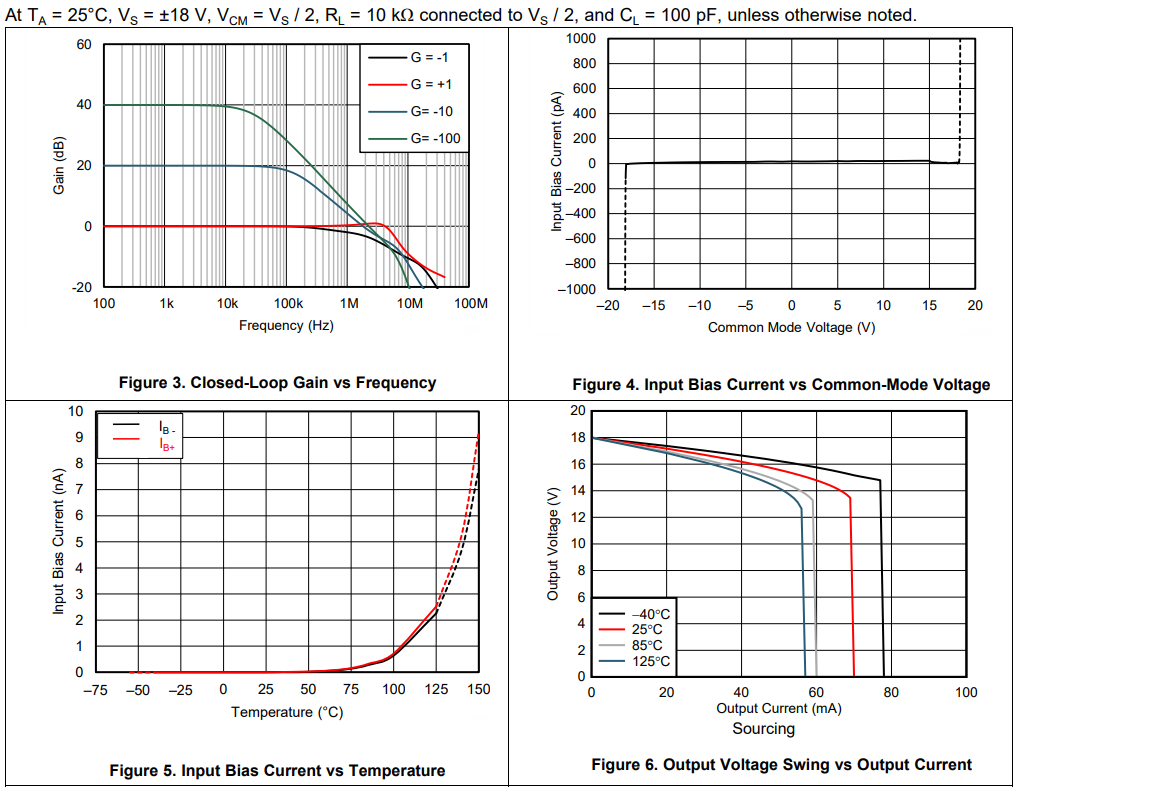
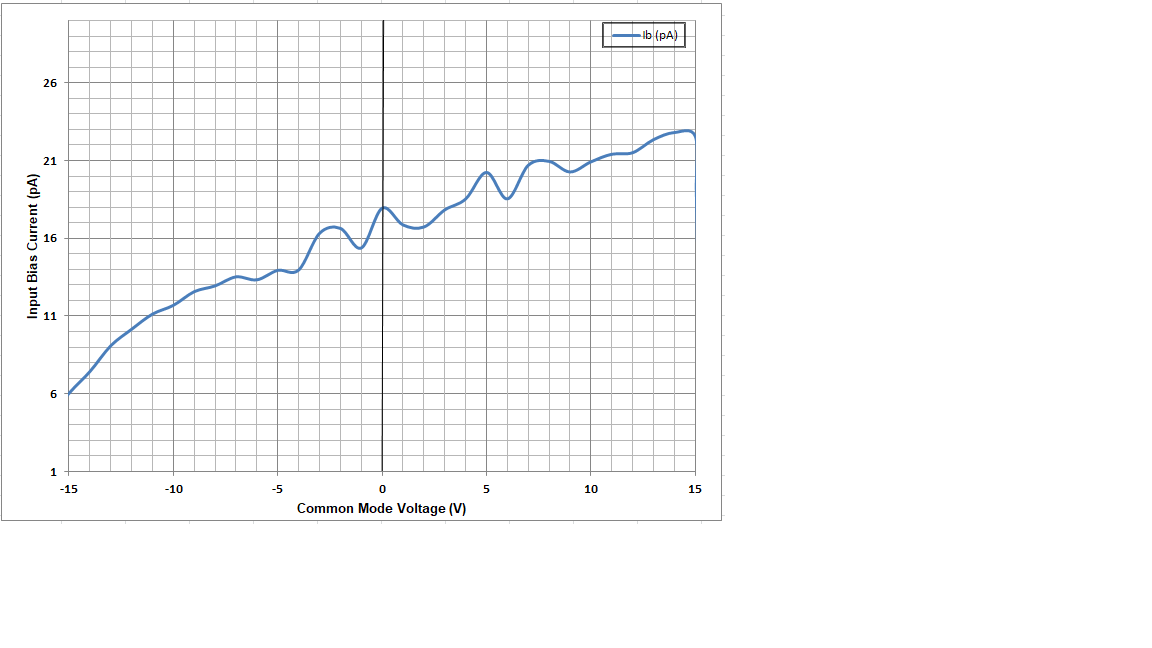
The OPA196 datasheet lists the input bias current maximum at 20pA. Does this 20pA maximum apply over the entire common mode input voltage ranges as depicted in figure 4 ?

  • It's difficult to interpret what the Ib vs. CM voltage variation is given the y-axis scaling (±1nA) the figure 4.
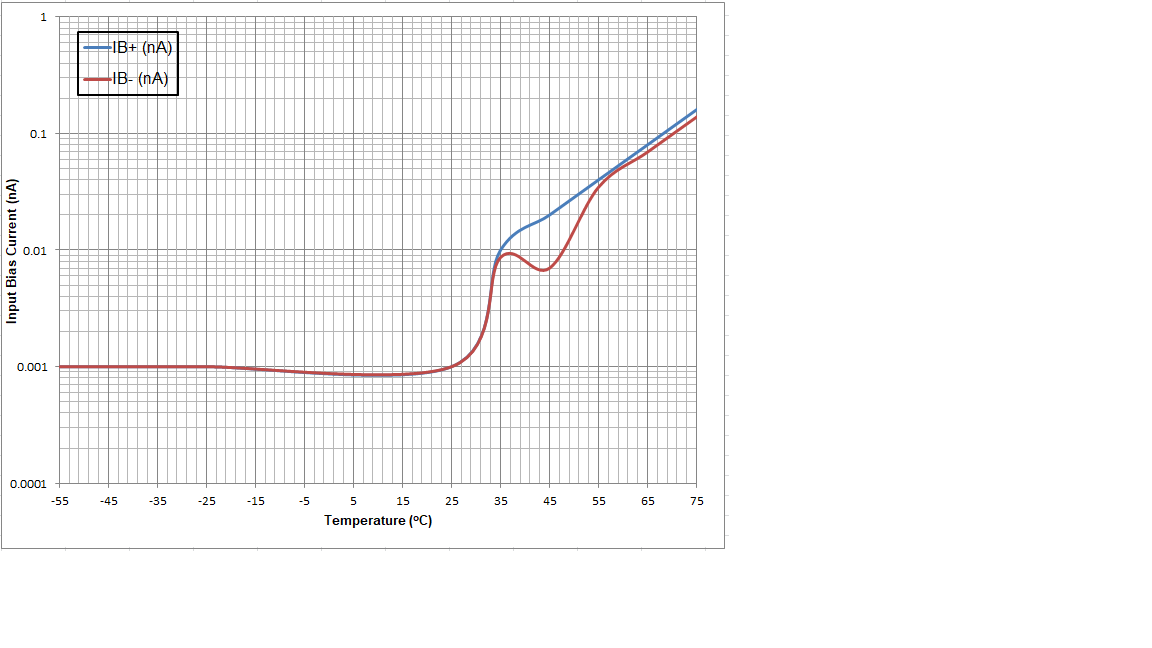
  • Also...can you confirm that the figure 5 y-axis units are in fact "nA" and not "pA". Same issue with this graph...hard to interpret the spec from -50°C to 75°C given the scaling used in the graph.

Thanks for the help.

  • Hi ,

    In OPA196 datasheet, the input bias current and common voltage plots are presented in Figure 4 and 5, see the image below. 

    Question:

    can you confirm that the figure 5 y-axis units are in fact "nA" and not "pA". Same issue with this graph...hard to interpret the spec from -50°C to 75°C given the scaling used in the graph.


    The vertical scale in Figure 5 is in nA scale. It is difficult to present such wide temperature range in a linear plot. I will request for a better graph from our characterization team per your temperature range from -50°C to 75°C.

    Best,

    Raymond

  • Thanks for the response. Yes, please provide any other characterization graphs you may have.

  • Hi ,

    Per your request, OPA196 sample's Input Bias Current vs. Common-Mode Voltage and Temperature Data:  

    OPA196 Op Amp' s Input Bias Current vs. Common-Mode Voltage for Figure 4 with finer vertical scale is shown below. 

    OPA196 Op Amp's Input Bias Current vs. Temperature for Figure 5 with finer vertical scale is shown below. 

    Best,

    Raymond