A related question is a question created from another question. When the related question is created, it will be automatically linked to the original question.
If you have a related question, please click the "Ask a related question" button in the top right corner. The newly created question will be automatically linked to this question.
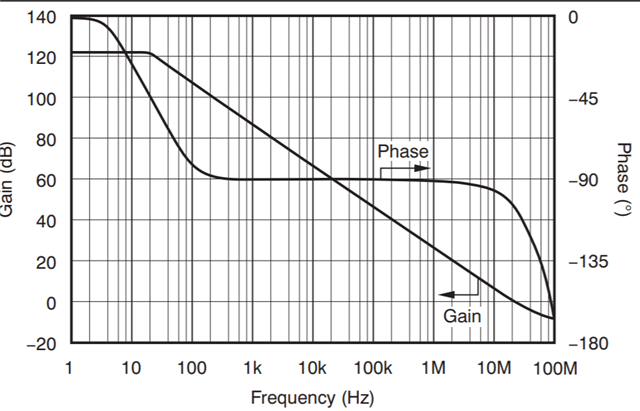
How to get the Open-Loop Gain and Phase vs Frequency figure?
There are multiple methods to verify AOL gain and phase compared to the datasheet specifications. It is possible to use SPICE to simulate AOL. Application Note 1516 section 2.1 has detailed information on how to use TINA-TI to create AOL gain/phase waveforms (AN 1516 attached here: AN1516).
If it is desired to measure the performance of a particular DUT, it is possible to test AOL using a bode analyzer. Using a bode 100, it is possible to close the loop of the amplifier and obtain accurate values for AOL knowing the gain of the circuit (document here explains test conditions in further detail: Bode100AOL).
To answer your second question, AOL gain/phase waveforms demonstrate typical device performance, and data is obtained via testing.
Additional resources can be found here in our TIPL lectures covering bandwidth for amplifiers: TIPL Link.
Let me know if this helps you with understanding how to calculate/measure AOL.