This thread has been locked.

If you have a related question, please click the "Ask a related question" button in the top right corner. The newly created question will be automatically linked to this question.

CDCVF2505: Please explain Figure.10 "Propagation Delay Time vs Delta Load"

Part Number: CDCVF2505

Hi,

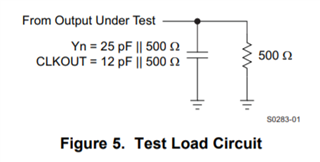
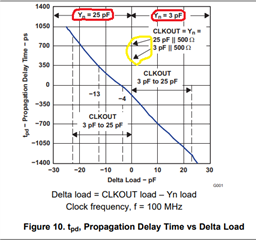
Could you please explain Figure.10 "Propagation Delay Time vs Delta Load"?    In particular, negative side of delta load is Yn=25pF (Red circule).  What does this mean?   Also, What does Yellow Arrow means?

Anyway, I want to know this graph.

Thanks and best regards,
M.HATTORI.

  • Hello Hattori,

    Yn represents the clock outputs (Y0, Y1, Y2, or Y3). When the plot says Yn = 25 pF, then this means that the clock output Yn had a 25 pF capacitance load on it when the propagation delay measurement was made from the -30 pF to 0 pF delta load range.

    The yellow arrows mean that when the delta load is 0 pF, the CLKOUT load and the Yn load are 3 pF in parallel with 500 ohms and 25 pF in parallel with 500 ohms similar to the image shown below.

    Regards,

    Kia Rahbar