This thread has been locked.

If you have a related question, please click the "Ask a related question" button in the top right corner. The newly created question will be automatically linked to this question.

PLLATINUMSIM-SW: Bode Plot

Part Number: PLLATINUMSIM-SW

HI team,


I have two questions regarding the Bode plot of this simulator. Could you please answer the following questions?

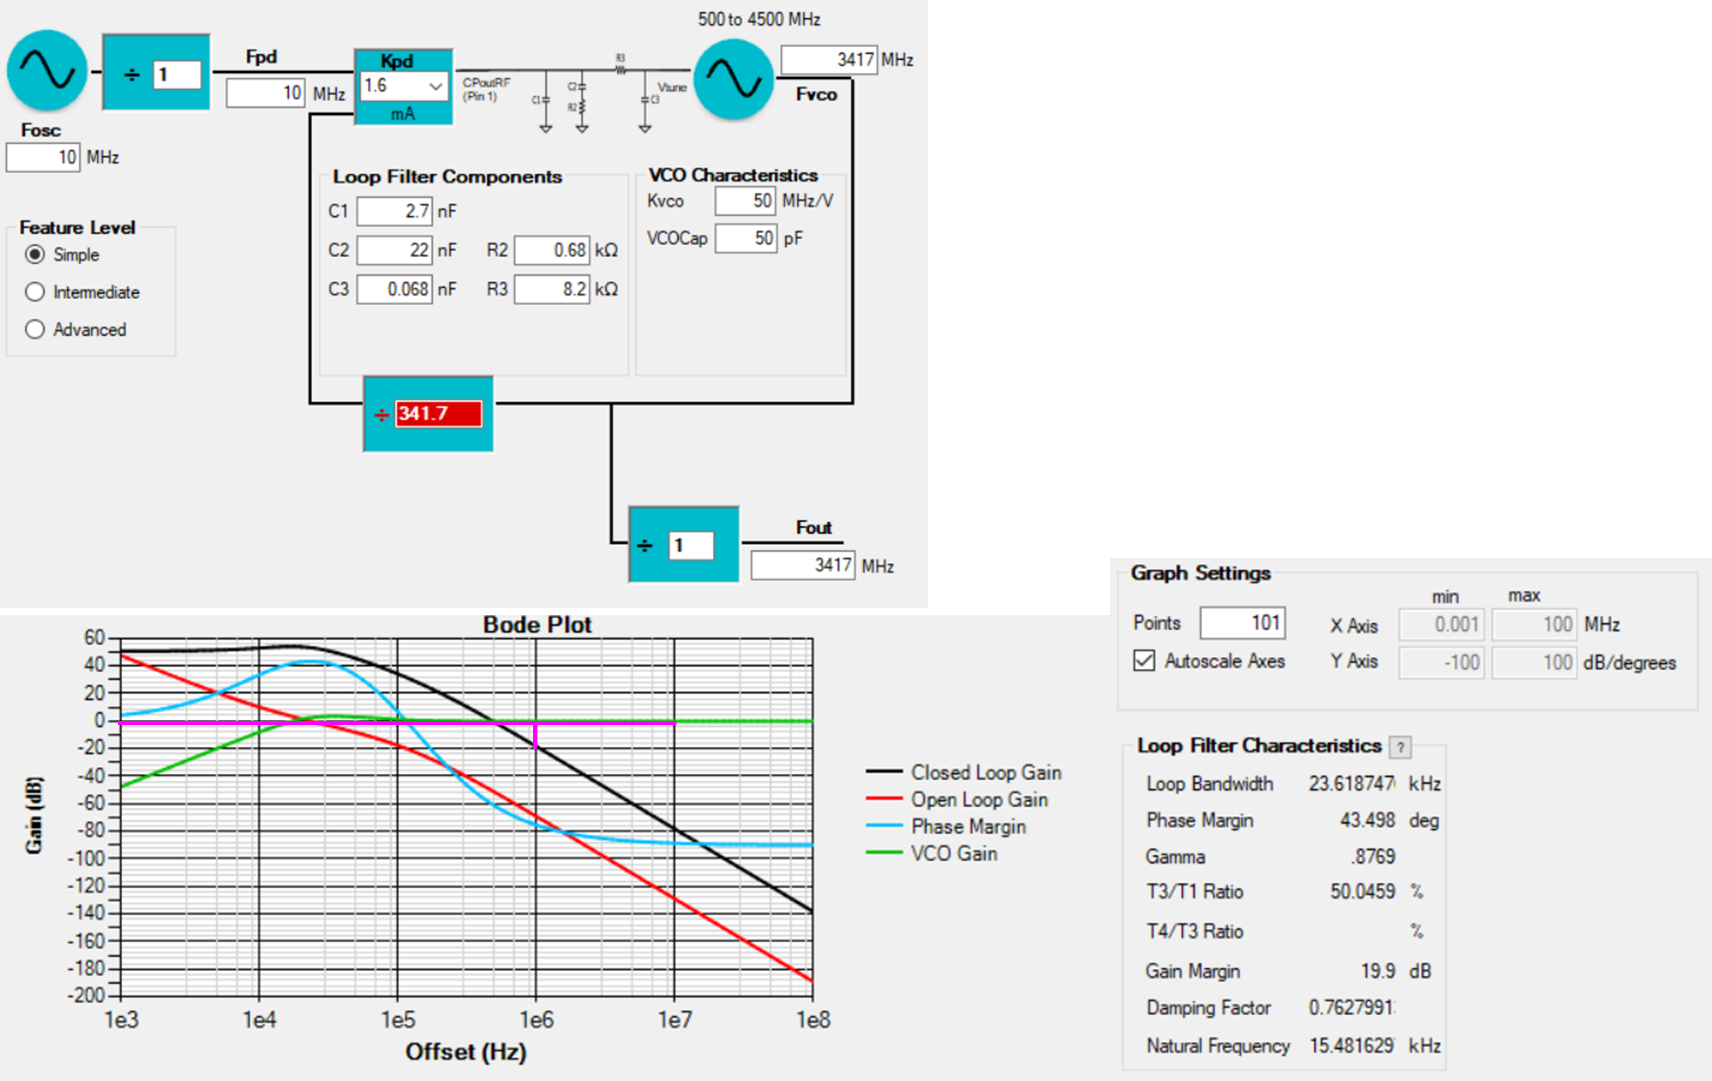
(1) In a typical Bode plot, the horizontal axis represents frequency. However, the horizontal axis of this graph represents the offset. Does this represent the offset frequency from the set frequency?

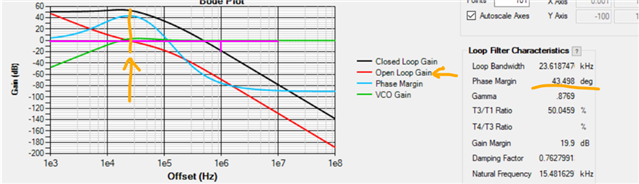
(2) In the figure below, the Phase Margin is 43.498 degrees . How can this be determined from the graph? In a typical Bode plot, you would look at the frequency when the gain is zero, which would result in a phase margin of around 20 degrees. Please explain how to interpret the graph and how to determine the phase margin.


Thank you for your helpa122.png
Regards,

Taito Takemura

  • Hi Takemura-san,

    (1) right, offset means offset frequency. For example, instead of saying 100.001MHz, 100.01MHz, we say 1kHz offset, 10kHz offset.

    (2) Phase margin is determined when the gain is zero. Blue trace is the phase margin.

  • HI Noel,

    Thank you for your answer. I'm confused about some points, so could you please explain?

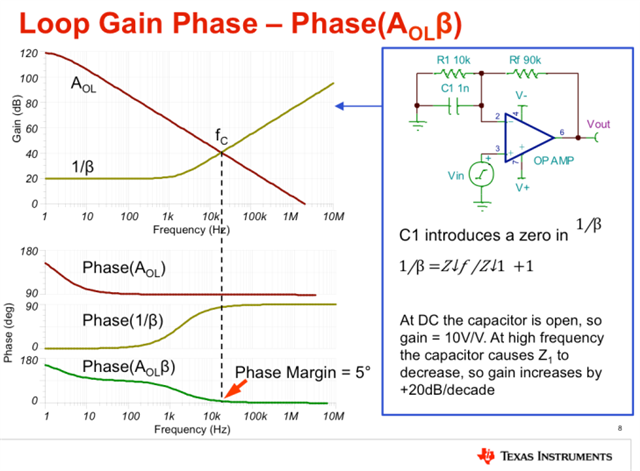
    Typically, when this Bode plot is used with operational amplifiers (op-amps), the parameters are defined as follows:
    - Aol: Open-loop gain (gain of the op-amp alone)
    - beta: Feedback coefficient
    - Aol x beta: Loop gain
    - Acl: Closed-loop gain (Acl = Aol/(1 + Aol x beta)) (actual gain of the op-amp circuit)

    As shown in the figure below, the phase margin is defined as the phase at the point where Aol x beta = 0 [dB], that is, when Aol = 1/beta holds true.

    In your previous answer, you said the phase margin as the phase at the point where the open-loop gain is zero, not the loop gain. Why is this allowed?

    Refgards,

    Taito Takemura

  • Hi Takemura-san,

    Bode plot usually applies to control loop system, the amplifier example I believe is regarding the design of a non-inverting amplifier.

    FYI, below link has some bode plot introduction.

    www.rohde-schwarz.com/.../understanding-bode-plots_254514.html