Part Number: TSW14J56EVM
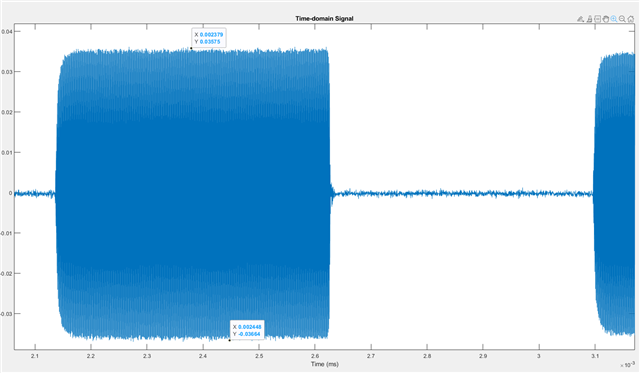
I am using the TSW14J56EVM to record data from an ADC12J4000EVM board. When I save the data as a raw binary file I am unable to plot it correctly in MATLAB. I saw another post where someone used the code below, but they had a similar scaling issue that I have. I captured a -20dBm CW signal and see it correctly in HSDC pro, but when I save the data out I do not get the same values. The time domain signal has a mV range between +/- .035mV and the HSDC pro is showing +/-.1mV. Is there something wrong with the code below? Do I need to parse out each channel or only look at channel 1?
Thanks for your time,
Kyle
fileID = fopen('redo_200cycles_-20dBm.bin');
A = fread(fileID,Inf,'int16');
fclose(fileID);
Bits=12;
A = A - 2^(Bits-1);
Vfs=725e-3/2;
fs = 4000e6;
T=1/fs;
L = length(X);
t = (0:L-1)*T;
figure;plot(t*1000,X)
title('Time-domain Signal')
xlabel('Time (ms)')
ylabel('X(t)')X = Vfs*A/2^(Bits-1);


