This thread has been locked.

If you have a related question, please click the "Ask a related question" button in the top right corner. The newly created question will be automatically linked to this question.

ADS1232: Sudden level shifts are plaguing us

Part Number: ADS1232

We have been using ADS1232 in high resolution load cell applications since ~2010. Recently we've had an increasing number of sudden, inexplicable level shifts that ruin long-term recordings. To show you what we're dealing with, here is a good recording (duration about 80 hours):

A good load cell recording

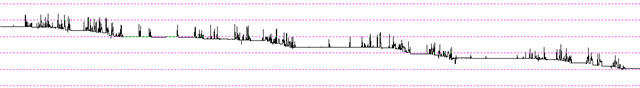
The occasional disruptions are expected, and caused by interactions with the load cell that we need to quantify. As you can see, between interactions the load cell signal is nice & constant. The slow decline over the 80 hours of the recording is exactly what we expect.

Here, in contrast, is a bad recording:

A bad recording

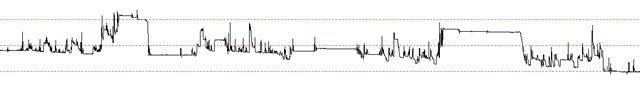
As you can see, the trace shows sudden level shifts, steps up or down, that appear at random & have different amplitudes. This makes it impossible to quantify the interactions, because they are riding on a hugely variable signal.

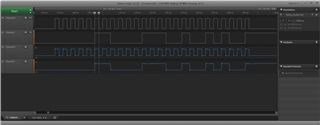
At first we thought that we had clock issues, because the changes are step-like & could be caused by mis-shifting data. However the clock & data lines are short (a few cm) and appear to be clean (scoping with a digital 'scope & a Saleae logic analyzer). We get this issue with 2 different microcontrollers (a PIC & an ESP32). And of course we initialize the ADS1232 correctly, including an initial offset calibration.

This is driving us insane (or at least, even less sane than we were to start with). Do you have an suggestions that might help us?

Thanks in advance!

  • The clock and data signals look very good when measured by a Saleae logic analyzer. Data is sampled just before the falling edge of the high phase of the clock signal.

  • Hi John and C Kelley,

    I would be glad to be able to give some guidance and help, but unlike you being familiar with your system,  I have no idea what you are doing nor the tests being performed.

    Graphically I see what you are describing, but unfortunately I don't understand the actual variation as a number of codes.  The 'good' plot shows a number of scale lines as 6 while the 'bad' plot shows 3 lines.  For me to better understand what is happening it would be best to see a dataset that is in ADC result codes as opposed to a graph.  A schematic would also be useful.

    If the graph is over an 80 hour period, how often are the measurements taking place?  Are you powering down the ADS1232 between readings?  Can you explain in further detail how the tests are being conducted?

    Bests regards,

    Bob B

  • Our application is a loadcell measuring mass loss in grams (actually milligrams) over time. The 24 bit resolution allows us to measure down to the milligrams. Sudden level shifts as shown in the second graph makes that impossible.

    Readings from the ADC are at 10Hz put through an Infinite Impulse Response filter. The graphs above show data collected at 1 Hz.
    We do not perform any power down on the ADS1232 at any time. Our latest attempt to mitigate bad data involves performing an offset calibration but those results are not in yet. 

    The spikes represent interactions with the loadcell. Flat areas are times of no interaction with the loadcell. After each interaction, we expect the mass to go back to where it was or lower (mass removed from a hopper) as illustrated in the first graph. 

    The second graph indicates that the mass is not always returning to the values before the interaction and in many cases, it is significantly higher. While we expect the mass to be lower after interaction with the loadcell, sometimes the trend, absent the large shifts, is upward (gaining mass) instead of downward (losing mass). Other times, we see these "notches" much lower (rather than higher) after interaction then return to a more reasonable value after some other interaction later in the recording and those intervals vary as well as seen in the second graph.

  • Hi Bob,

    Thank you for your reply. In answer to your range question, graph 1 mean was 269.5g, with a range of 90.1g. The standard deviation of mass in the "quiet" periods, with no load cell interaction, is < 2mg over 60 seconds. This is the kind of performance we need, because the effects of the interactions with the load cell can be quite small. Graph 2, on the other hand, has about the same mean value but shows wild, abrupt swings of up to ~50-60g, making the data impossible to analyze. We will de-transform the mass data and get you (an approximation of) the original ADS1232 ADC codes, but this is complicated by the IIR filter.

    One interesting clue: In one recording, the mass abruptly switched from ~ +300g to ~ -300g (by "abruptly" I mean in < 1 sec), which suggests that the MSB (sign bit) was mis-read & continued to be mis-read for the rest of the recording. This makes us suspect that there is a problem with reading the output of the ADC. But the problem persists even though we have tried two microcontrollers running different firmware. Here's a section of that recording showing the step change (Y axis in g, X axis in hours):

    We operate the ADC by polling & waiting for the DATA line to go low, indicating EOC, then shifting out the data. The interval between the DATA line going low & clocking out the data should never exceed ~1msec, worst case.

    We can send you a circuit diagram if you think it might be helpful & if we can email it directly to you rather than posting it here.

    John

  • Hi John,

    Just so I'm clear, this phenomena is from an old design?  Or an updated design?  Is there anything that may have changed from the previous design to the one now tested (such as new PCB fab build, different solder/flux, different batch of ADS1232 devices, etc.)? 

    Also, I can analyze the Saleae plots of your data series if you have plots showing where the shift is taking place.  You can just attach the data (.logicdata) file into the thread.

    Best regards,

    Bob B