This thread has been locked.

If you have a related question, please click the "Ask a related question" button in the top right corner. The newly created question will be automatically linked to this question.

ADC3663EVM: Setup to replicate datasheet figure

Part Number: ADC3663EVM
Other Parts Discussed in Thread: ADC3663, OPA837, REF3318, LMK04828

Hello,

I`m trying to replicate one of the figures of the ADC3663 datasheet, to be sure my setup is right.
Concretely, I'm trying to replicate figure 6-40, Single tone FFT at Fin = 1 MHz.
The acquisition of the data is done through an FPGA board connected to the ADC3663 EVM. For the configuration of the EVM I`m using ADC35XX EVM GUI.
I have checked that the acquisition of the data is correct by using the ramp test pattern.

The rest of the setup is basically the default configuation of the EVM, except for the external supply. The setup is as follows:
- External 5V supply (J16 shunted in 1-2 position)
- External +1.6V voltage reference (REF3318 + OPA837 mounted on the board)
- External sample clock. Sample frequency: 65 MSPS
- External DCLKIN clock. Frequency: 260 MHz. Level: 10 dBm.
- Input signal: 1 MHz. A bandpass filter is used to eliminate harmonics from signal generator. Attenuation of harmonics is > 60 dB.
- Default components for glitch filter

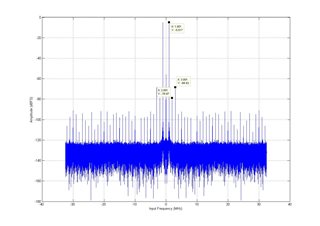
I am getting the attached figure.
The signal level is -5 dBFS, as I am not being able to get a higher level with my available instruments.
The noise floor is similar to that of figure 6-40, but harmonics are much higher than expected: HD2 is -78 dBFS (below -90 dBFS in datasheet) and HD3 is -68 dBFS (below -80 en datasheet)

I have tried to add a low pass filter (Fc = 65 MHz) for the sampling clock. I have also tried to change the clock`s amplitude. But I am not getting better results.

Is there anything else required to get the figure of the datasheet?

Thanks,
Miguel

  • Hi Miguel,

    You mention the signal level of -5 dBFS; however, for a two tone signal this over-ranges the part. For a 2 tone signal, the average power -> 10*log10(2) ~= 3.01029

    The equivalent -1 dBFS is  -1*((3.01029 * 2) + 1) = -7.0206 dBFS.

    So, the equivalent -1 dBFS tone for a two-tone measurement is -7 dBFS. Try adjusting the amplitude to this level and testing.

    Regards, Amy

  • Hi Amy,

    This is not a two tone signal measurement.  The input signal is a single tone with a frequency of 1 MHz.

    I'm sure the captured signal is not saturated.

    Regards, 

      Miguel

  • Hi Miguel,

    Can you share what you are using for a clocking source and input source? 

    Regards, Amy

  • Hi Amy,

    For the input source, I am using a signal generator from Agilent plus a band pass filter.  This filter attenuates harmonics more than 60 dB.

    For the clock source, I have tried two setups, both with the same results:

    - Signal generator from Agilent plus a low pass filter: cut-off frequency = 65 MHz, attenuation of harmonics > 60 dB

    - Signal generator from Agilent plus a LMK04828 ultra low noise clock jitter cleaner.

    The figure I attached in the first message was done with this latest setup.

    Regards,

      Miguel

  • Hi Miguel,

    Can you provide the model numbers of the signal generators that you are using? Additionally, what are you using for the data capture card?

    Regards, Amy

  • Hi Amy,

    The signal generators model is E4438C from Agilent.

    To capture the data, I am using the FPGA KCU105 evaluation kit. I think the data capture is ok, as I have checked it using the ramp test pattern of ADC3663.

    Regards,

      Miguel

  • Hi Miguel,

    Can you send us an FFT plot and reduce the analog input level by 5 or 10dBm on the signal generator?

    Also, are you using a filter on the output of the signal generator? This would also be an issue, showing lots of spurious content.

    Regards,

    Rob