This thread has been locked.

If you have a related question, please click the "Ask a related question" button in the top right corner. The newly created question will be automatically linked to this question.

DS90UB953-Q1: Use DS90UB960-Q1EVM to test margin

Part Number: DS90UB953-Q1
Other Parts Discussed in Thread: DS90UB960-Q1EVM, ALP

Hi,

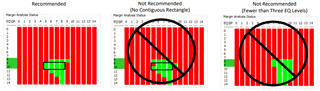
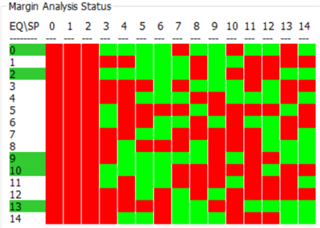
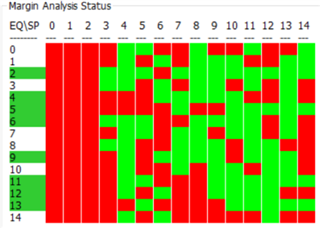
We connect TI 953(on our board) to the DS90UB960-Q1EVM. Then we get the Margin Analysis diagram as follows.

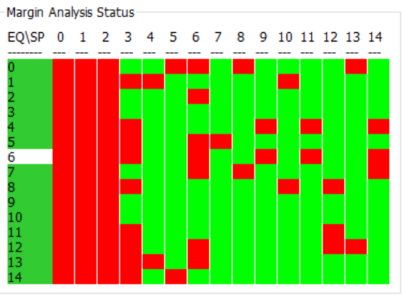
What do you think of this figure? Does this figure show that the connection between ti953 and ti960 is stable? Thanks.

  • Hello Guihui,

    The results from the MAP tool seem a bit unstable in certain EQ/Strobe settings. This is not an optimal result and this indicates there could be some improvements to be made in the PCB layout or even changes to the cable. But the results are still within an acceptable range and does not necessarily demand hardware changes, unless there are bench test results that indicate otherwise.

    Red squares indicate that an error was detected during the time when a specific EQ/Strobe settings was tested, which could affect the LOCK of the connected SER/DES devices. You can increase the dwell time in ALP to get more accurate results, but as long as there are at least 4 passing strobe positions and 3 passing EQ levels forming a continuous green rectangle, then the results can be used.

    There are continuous patches of green squares in the results that you shared, so there doesn't seem to be a need for hardware changes. But you would have to verify if there are any communication or data transfer issues between the SER/DES on a test bench. The scan range of the AEQ can be limited to just the continuous green areas in order to boost robustness of the link, but keep in mind not to limit the AEQ scan range by too much, in order to maximize the adaptability of the AEQ in normal operation.

    See the linked App Notes for more details on MAP results and how you can limit the AEQ scan range through register settings on the 960 device:

    https://www.ti.com/lit/ug/snlu243/snlu243.pdf?ts=1652282197222&ref_url=https%253A%252F%252Fwww.ti.com%252Fproduct%252FDS90UB960-Q1 

    https://www.ti.com/lit/an/snla301/snla301.pdf?ts=1652282969812 

    Best,

    Justin Phan

  • Hi Justin,

    We Continue testing the margin. Sometimes the  Margin Analysis diagram are as follows:

    From the above image, the test results are very unstable and different every time.

    Does this mean that the hardware environment is poor?

  • Hello Guihui,

    This does seem to indicate that the hardware between the SER/DES is poor. Keep in mind that we recommend a continuous green rectangle in the MAP results that is at least 4x3 squares.

    These results do not seem to be achieved in your setup.

    One thing you can check is the cable. See if changing the cable between the SER/DES will improve the MAP results. Also try a shorter cable. If the shorter cable does not provide a significant improvement in results, then the issue must be either the PCB components or PCB layout.

    Best,

    Justin Phan

  • Thank you for your help.