This thread has been locked.

If you have a related question, please click the "Ask a related question" button in the top right corner. The newly created question will be automatically linked to this question.

DS125DF410: Eye pattern algorithms

Part Number: DS125DF410
Other Parts Discussed in Thread: DS250DF410

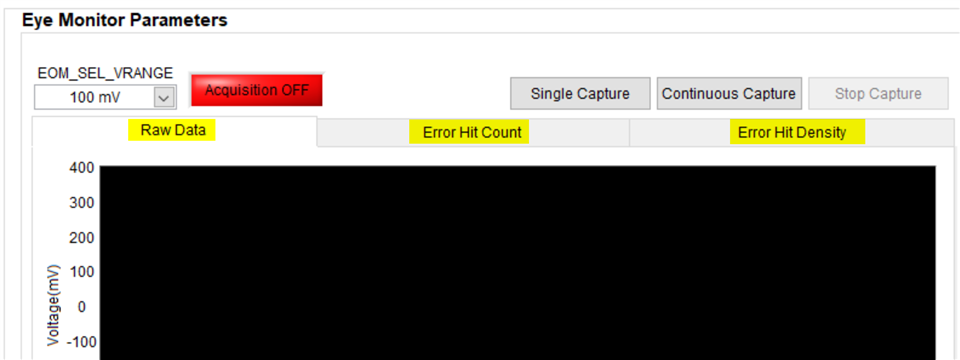
We have been using SigCon Architect to read the eye patterns of the incoming signals, and found that using various ways to visualize the data can provide a lot of insights to the signal quality. With SigCon, we have eye pattern options like Raw Data, Error Hit Count and Error Hit Density. Where can we find the algorithms for all those methods?
Thanks.

Child

  • Hi,

    The methodology for generating the raw 64 x 64 matrix of EOM data points is listed on the datasheet. I'll include here below also for ease of reference.

    Plotting an Eye Diagram

    The Eye Opening Monitor is capable of plotting an equalized, but non-retimed eye to represent the quality of signal that is going into the CDR block. This feature is useful for diagnosing gross signal integrity errors. The eye plot generated by the EOM cannot be used to extrapolate performance to bit error rates beyond 1e-7.

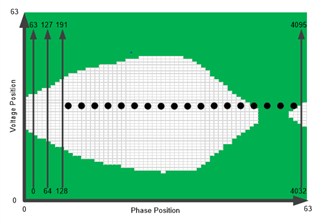
    The EOM generates the eye plot according to a 64 x 64 matrix. Each grid space in the matrix consists of a 16-bit word that represents the number of times the incoming data stream touches that particular phase and voltage level. The EOM under-samples the incoming data stream by recording the total hit count for each combination of phase and voltage, one grid space at a time.

    To configure the EOM to plot the eye diagram, sometimes called fast eye capture, use the following registers.

    Step

    Register[bits]

    Value

    Description

    1

    0x3E[7]

    0

    Disable lock EOM lock monitoring

    2

    0x2C[6]

    0x11[7:6]

    0

    2’b xx

    Set the desired EOM vertical range as 2’b xx

    3

    0x11[5]

    0

    Power on the EOM

    4

    0x24[7]

    1

    Enable fast EOM

    5

    0x24[0]

    0x25

    0x26

    1

    When 24[0]  is 1 begin read out of the 64 x 64 array, discard first 4 bytes
    This bit is self-clearing.

    6

    0x24[0]

    0x25

    0x26

    1

    Continue reading information until the 64 x 64 array is complete.

    7

    0x3E[7]

    0x2C[6]

    0x11[5]

    0x24[7]

    1

    1

    1

    0

    Return the EOM to its original state. Undo steps 1-4

    The data recorded from the Eye Opening Monitor (EOM) begins at (X, Y) position (0, 0) and proceeds to position (0, 63). Next, the Y-value is reset to 0 and the X-value is incremented. This process is repeated until the entire 64 x 64 matrix is read out.

    In terms of visualizing the raw data our recommendation is below.

     Thanks,

    Rodrigo Natal

  • Rodrigo,

    Thanks for the information about the Raw Data plotting method. Can you also share with us the procedures for the Density and Hit Count plots?

    Thanks.

    Child

  • Hi Child, the instructions are all there in my reply post. See the bottom snapshots, including the table with example color schemes.

  • Rodrigo,

    I may have some misunderstanding about what the coloring/hit count scheme can do.

    The two eye plots are quite different and there has to be some difference in how the (same set of) data is used to plot them out. Can you provide us with more insight?

    Can you also direct us to the document where you extracted the eye plotting algorithms from? We could not find the info from the EVM user's guide, chip datasheet or the programming guide.

    Thanks.

    Child

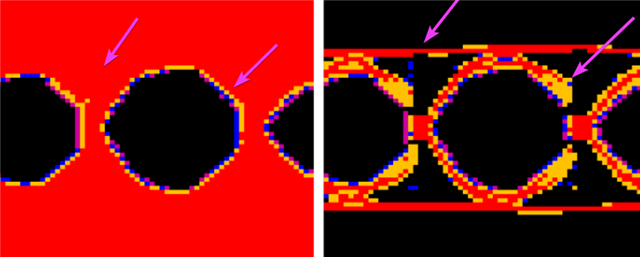
  • Per my previous post, the density plot was generated by taking first derivative of EOM data. These plots are taken from the DS250DF410 programming guide. this retimer uses the same EOM architecture as DS125DF410. You may request download access to DS250DF410 programming guide via TI link below.

    https://www.ti.com/lit/ds/symlink/ds250df410.pdf

  • Rodrigo,

    Thanks for the link. We downloaded the DS250DF410 datasheet but we could not find Table 53 and Figure 1 that you showed in your post. Can you send us the link to the document that you are looking at?

    In addition, I believe my question is similar to the following one:

    LMH1218 - How to display eye open monitor (EOM) in error hit density mode. - Interface forum - Interface - TI E2E support forums

    Could you give us more details which were communicated via private emails?

    Thanks.

    Child

  • my apologies, i shared the wrong link. see below.

    https://www.ti.com/drr/opn/DS250DF410-DESIGN

    To find the density you just take the derivative as per my previous post.

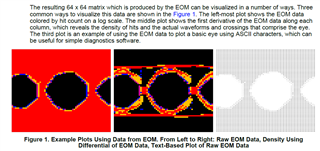
    The resulting 64 x 64 matrix which is produced by the EOM can be visualized in a number of ways. Three
    common ways to visualize this data are shown in the Figure 1. The left-most plot shows the EOM data
    colored by hit count on a log scale. The middle plot shows the first derivative of the EOM data along each
    column, which reveals the density of hits and the actual waveforms and crossings that comprise the eye.
    The third plot is an example of using the EOM data to plot a basic eye using ASCII characters, which can
    be useful for simple diagnostics software.

    Table 53. Example Color Scheme for Eye Monitor Data

    COLOR

    ASCII CHARACTER

    HIT COUNT RANGE

    Black

    [space]

    0

    Magenta

    .

    [1, 10)

    Blue

    +

    [10, 100)

    Yellow

    *

    [100, 1000)

    Red

    #

    > 1000

    Thanks,

    Rodrigo